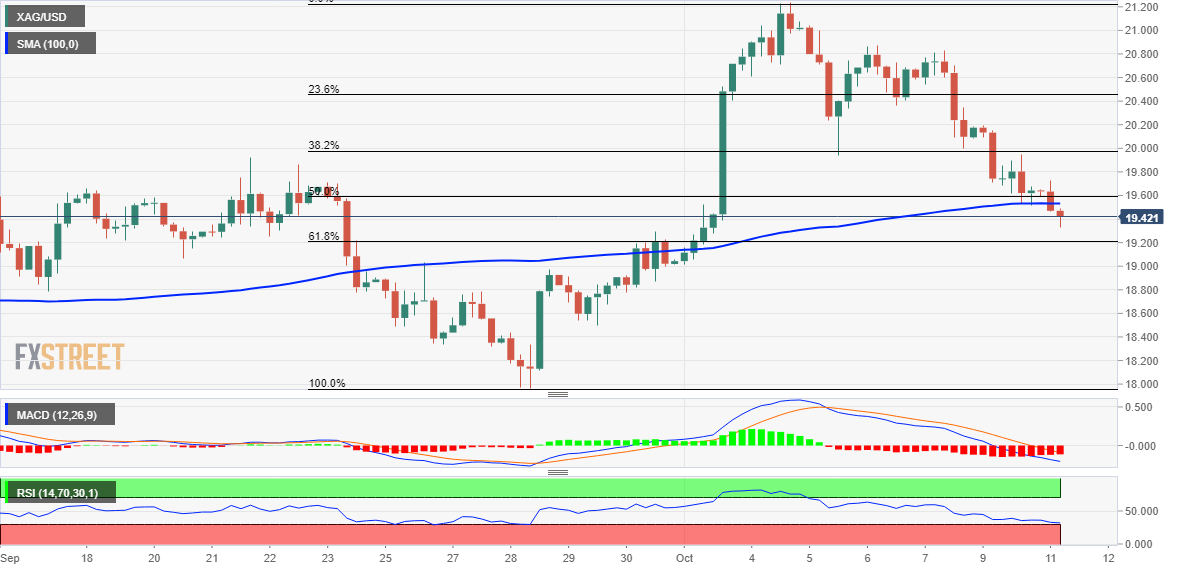
Silver Price Analysis: XAG/USD turns vulnerable below 50% Fibo./100-period SMA confluence
- Silver continues losing ground for the third straight day and drops to over a one-week low.
- Acceptance below the $19.60-$19.55 confluence supports prospects for additional losses.
- Weakness below the 61.8% Fibo., around the $19.30 region will reaffirm the negative bias.
Silver extends its recent pullback from the highest level since late June touched last week and remains under some selling pressure for the third straight day on Tuesday. This also marks the fourth day of a negative move in the previous five and drags the white metal to over a one-week low, around the $19.35 region during the early European session.
From a technical perspective, weakness below the $19.60-$19.55 confluence could be seen as a trigger for bearish traders. The said support breakpoint comprises the 50% Fibonacci retracement level of the recent recovery from the YTD low and the 100-period SMA on the 4-hour chart. The breakdown, in turn, supports prospects for further losses.
Hence, a subsequent fall towards 61.8% Fibo. level, around the $19.30 region, en route to the next relevant support near the $19.00 mark, remains a distinct possibility. Some follow-through selling will pave the way for a slide towards the $18.60 area before the XAG/USD eventually drops to the $18.35 area and then to the $18.00 round figure.
On the flip side, recovery back above the $19.60-$19.55 confluence has the potential to lift spot prices back towards the $20.00 psychological mark, which coincides with the 38.2% Fibo. level. Any further move up could attract some sellers near the 23.6% Fibo. level, around the $20.40 region, which should cap the upside for the XAG/USD, at least for now.
Sustained strength beyond will negate any near-term negative bias and allow the XAG/USD to climb to the $20.80-$20.85 area en route to the $21.00 mark and the monthly high, around the $21.25 region.
Silver 4-hour chart

Key levels to watch
