USD/MXN Price Analysis: Retreats to near 17.16 before immediate support at seven-day EMA
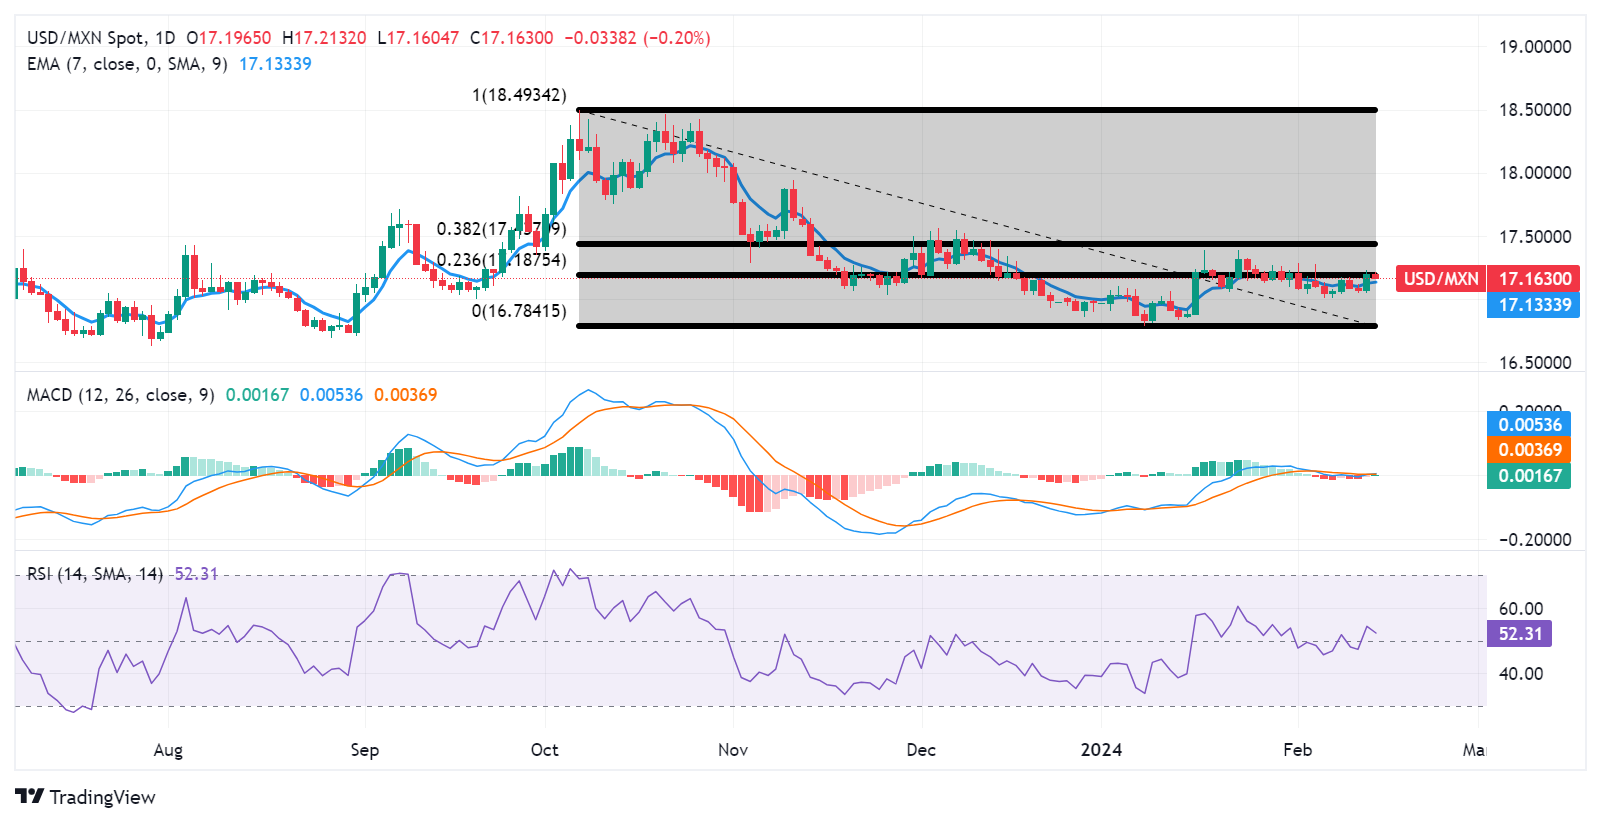
- USD/MXN could find immediate support at the seven-day EMA at 17.13 followed by the weekly low at 17.04.
- Technical analysis suggests a confirmation of the bullish sentiment towards an upward trend.
- The key resistance appears around the 23.6% Fibonacci retracement at 17.18 followed by the major support at 17.50 level.
USD/MXN snaps the recent gains and edges lower to near 17.16 during the European hours on Wednesday. The immediate support appears at the seven-day Exponential Moving Average (EMA) at the 17.13 level.
A break below the latter could put pressure on the USD/MXN pair to navigate the major support region around the weekly low at 17.04 aligned with the major level and February’s low at 17.00 level.
The 14-day Relative Strength Index (RSI), a momentum oscillator that measures the speed and change of price movements is positioned above the 50 mark, indicating the bullish momentum for the USD/MXN pair.
Additionally, Additionally, the lagging indicator “Moving Average Convergence Divergence (MACD)” lies above the centerline and the signal line, which suggests a confirmation of a bullish sentiment towards an upward trend.
On the upside, the USD/MXN pair could find the immediate resistance at the 23.6% Fibonacci retracement at 17.18 followed by the 38.2% Fibonacci retracement at 17.43, in conjunction with the major support at the 17.50 level. A breakthrough above the major barrier could lead the USD/MXN pair to explore the area around the 17.60 level.
USD/MXN: Daily Chart

