AUD/USD Price Analysis: Bull Flag continuation pattern probably in process of completing
- AUD/USD is probably completing a Bull Flag continuation pattern with bullish implications.
- A break above the May 16 high would validate the pattern and indicate more upside to the pattern’s price targets.
- The pair has drifted sideways into support from the bottom of a rising channel and reached a pivotal moment in its evolution.
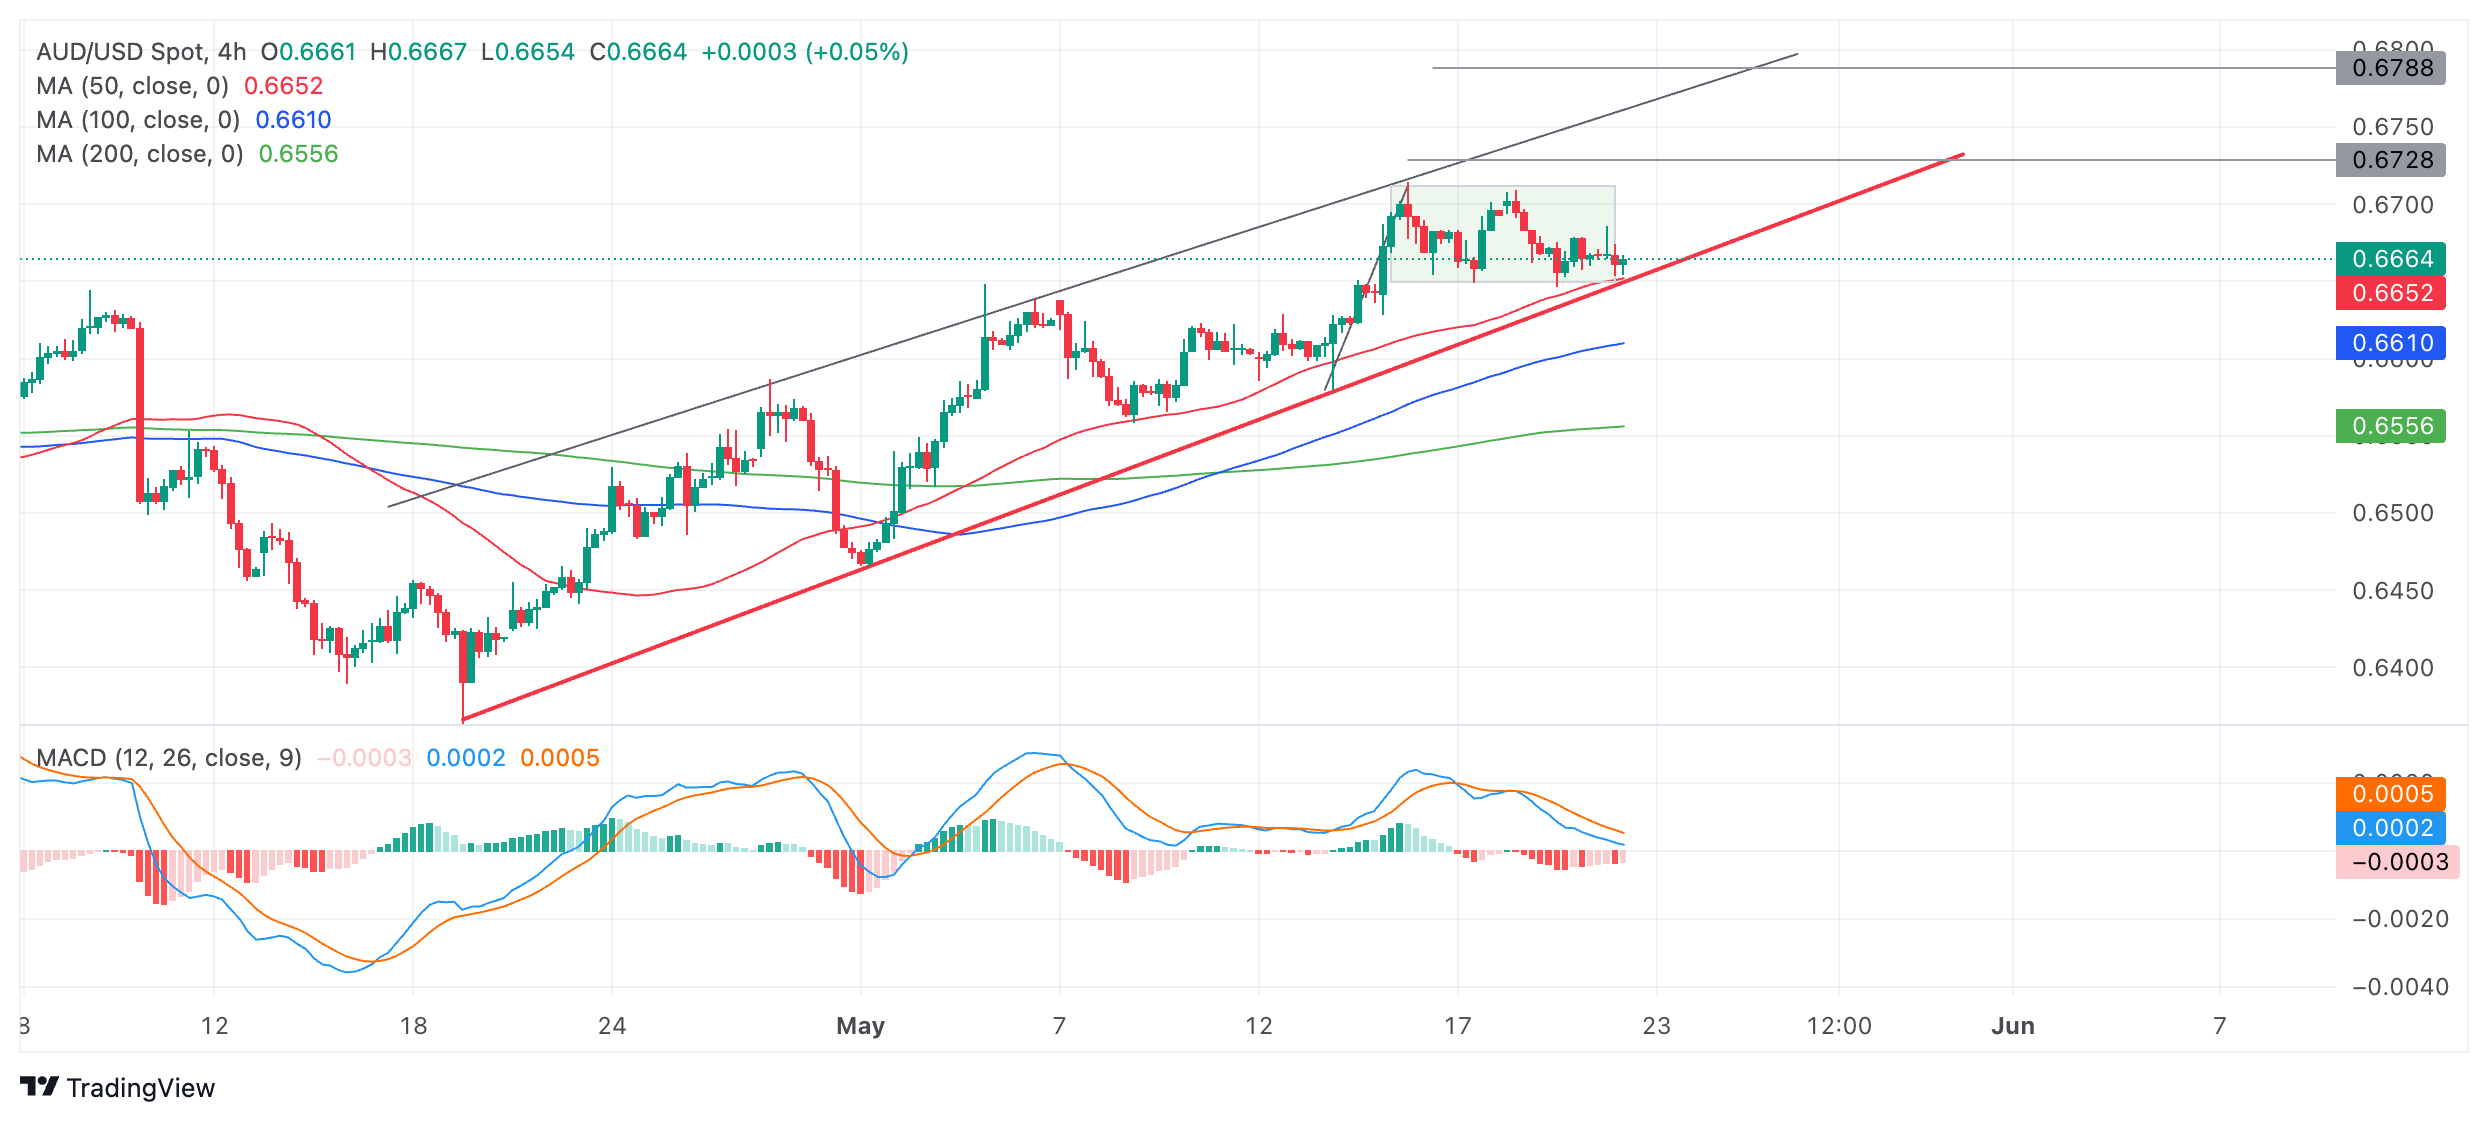
AUD/USD is potentially forming a Bull Flag continuation pattern on the 4-hour chart. These patterns are composed of a sharp rally – the “flagpole” – followed by a rectangular consolidation – the “flag square”.
Bull Flags are a sign the uptrend is taking a pause before continuing higher. The subsequent rally can be estimated by taking the length of the flagpole and extrapolating it from the base of the consolidation higher, or a Fibonacci ratio of the length.
A break above the top of the flag square (shaded rectangle on chart below) at around the 0.6714 May 16 highs, would confirm activation of the Bull Flag. Such a move would be expected to extend the uptrend up to an initial target at 0.6728, the 0.618 Fibonacci extension of the flagpole. A second more optimistic price objective lies at 0.6788, the full length of the flagpole.
AUD/USD 4-hour Chart

The Aussie is in a rising channel and price has now pulled back to the red lower trendline of the channel. This indicates price has reached a pivotal moment – if it breaks higher it will validate the Bull Flag hypothesis and activate the patterns targets. This is the more likely outcome given the AUD/USD is in a short-term uptrend, and as the old saying goes, “the trend is your friend”.
However, a decisive break below the red trendline would invalidate the Bull Flag and bring the short-term uptrend into doubt.
A decisive break would be characterized as one that was accompanied by a long red candle that closed near its low or three red candles in a row that broke through the trendline.
