Silver Price Forecast: XAG/USD plummets below $30 as US Dollar rebounds with focus on US NFP
- Silver price dives below $30 as the US Dollar recovers amid caution ahead of US NFP data.
- Market speculation for the Fed reducing interest rates in September improves.
- Silver price weakens after a Double Top breakdown.
Silver price (XAG/USD) declines below the psychological support of $30.00 in Tuesday’s European session. The white metal weakens as the US Dollar (DXY) rebounds amid uncertainty ahead of United States (US) Nonfarm Payrolls (NFP) data for May, which will provide cues about whether the Federal Reserve (Fed) will start lowering key borrowing rates from their current levels in the September meeting.
The US Dollar Index (DXY) rebounds after falling to a multi-week low near 104.00. The appeal for dollar-denominated commodities, such as Silver, weakens as higher US Dollar makes them expensive.
Currently, the speculation for the Fed reducing interest rates in September has strengthened as recent US economic data has indicated signs of slowdown in the pace of US economic growth.
The US ISM manufacturing PMI showed that factory activity contracted for the second straight month, demand outlook is bleak and input prices expanded at a slower pace. Recently, the US Q1 Gross Domestic Product (GDP) was also revised lower to 1.3% from the preliminary estimates of 1.6%.
In today’s session, investors on the JOLTS Job Openings data for April, which will be published at 14:00 GMT. US employers are estimated to have posted 8.34 million jobs, lower than the prior reading of 8.49 million.
Silver technical analysis
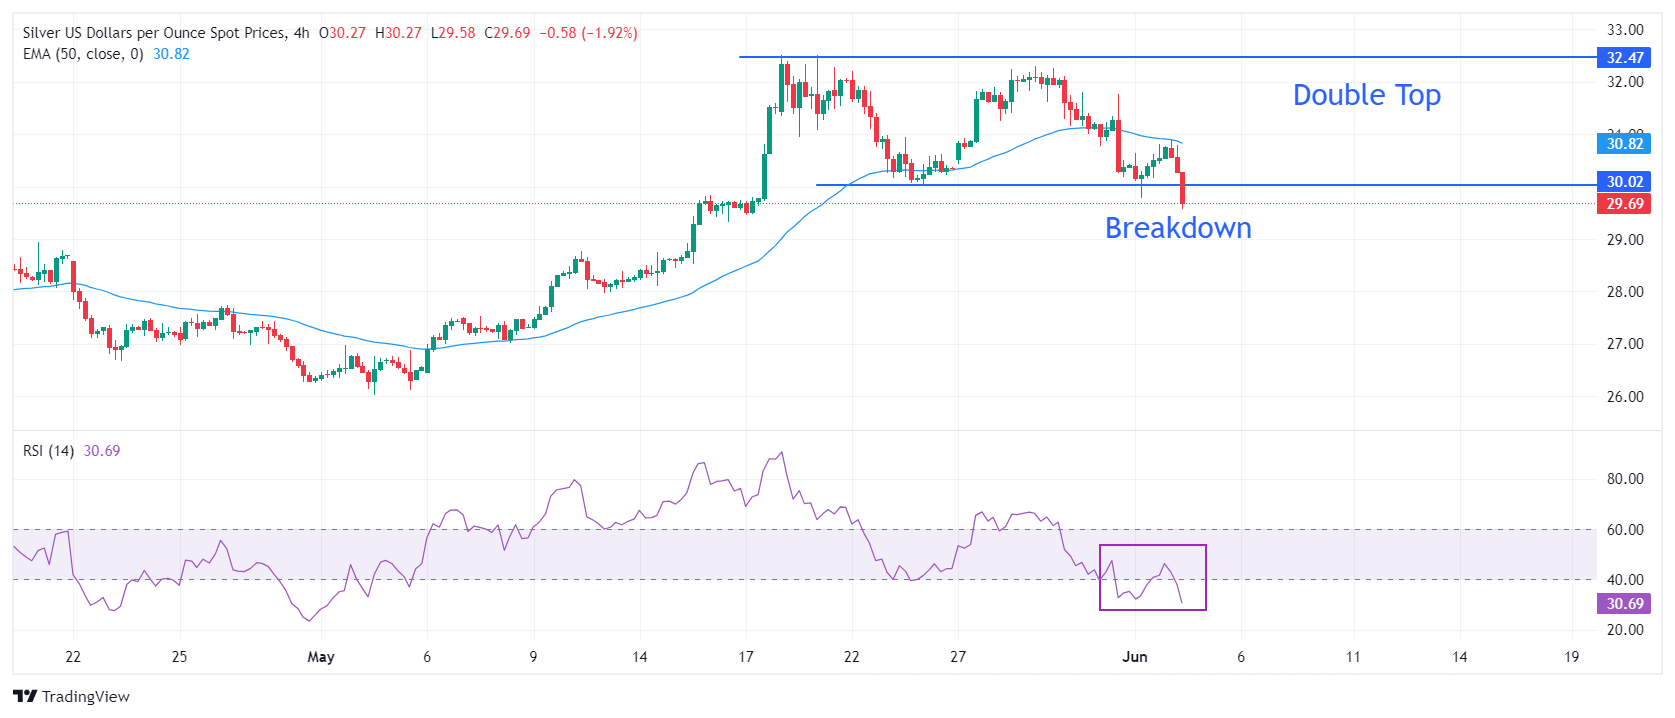
Silver price weakens after a breakdown of the Double Top chart pattern formed on a four-hour timeframe. The chart formation was at multi-year high of $32.50 and it got triggered after breaking below May 24 low near $30.00. A breakdown of the above-mentioned chart pattern indicates a bearish reversal.
The asset has shifted below the 50-period Exponential Moving Average (EMA) near $30.80, which indicates that the short-term trend has turned bearish.
The 14-period Relative Strength Index (RSI) has shifted into the bearish range of 20.00-40.00, which suggests that momentum has leaned towards the downside.
Silver four-hour chart