GBP/USD technical analysis: On the back foot below 1.2512/05 supply-zone
- GBP/USD takes another U-turn from eight-day long horizontal resistance.
- Technical indicators portray weakness in the momentum.
- Week-Long rising trend-line acts as nearby support.
Following its another pullback from multi-day old supply-zone, GBP/USD declines to sub-1.2470 area ahead of the UK open on Wednesday.
Not only failure to cross multiple mid-month highs and 23.6% Fibonacci retracement of September 12-20 upside but downward sloping 14-bar relative strength index (RSI) and the bearish signal from 12-bar moving average convergence and divergence (MACD) indicator also favor pair sellers.
During the declines, 1.24450 can act as immediate support before highlighting a week-old ascending support-line, at 1.2420.
Should prices decline below 1.2420, September 17 low nearing 1.2390 and 1.2360 can entertain the bears.
Meanwhile, pair’s run-up beyond 1.2512 could initial question monthly tops near to 1.2582 ahead of targeting 1.2600 round-figure.
GBP/USD hourly chart
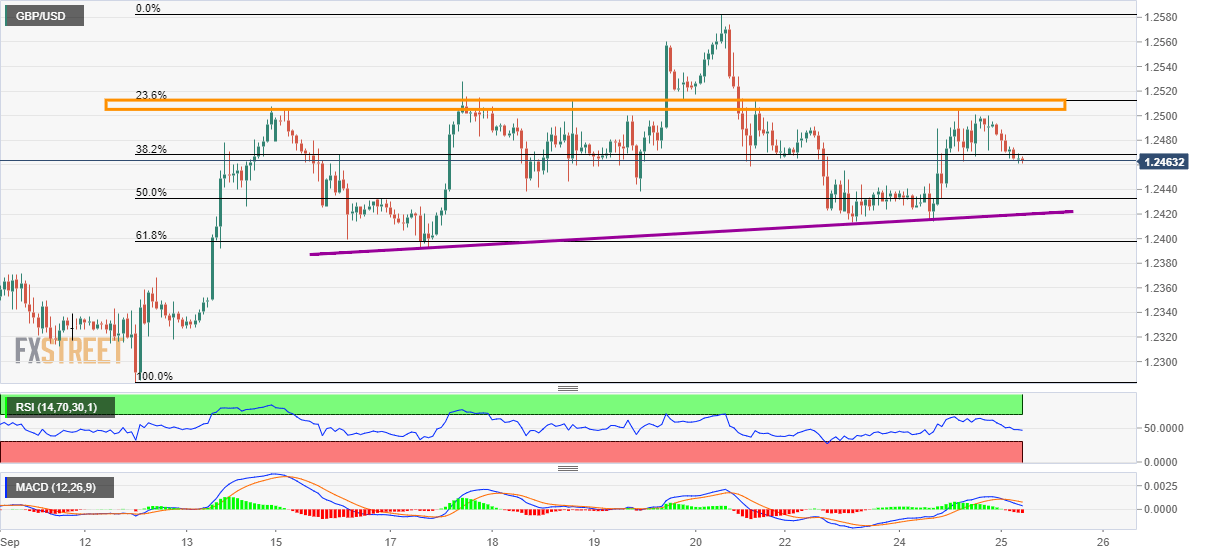
Trend: bearish