Back
27 Nov 2019
USD/JPY Technical Analysis: US GDP boosts greenback against yen
- USD/JPY is nearing the November highs while trading above the 109.00 handle.
- Breaking: US GDP, durables beat expectations, USD/JPY hits new highs.
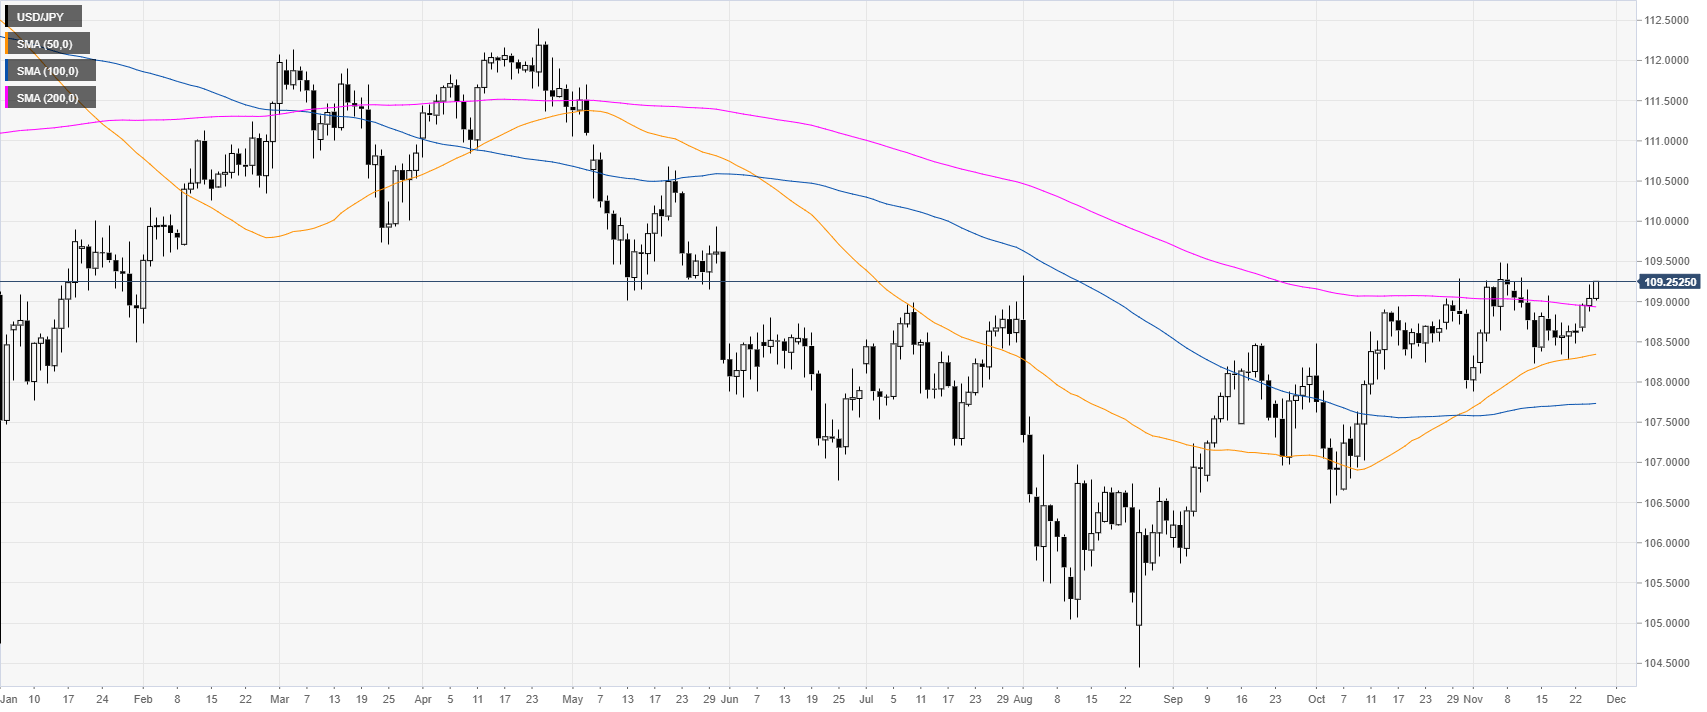
USD/JPY daily chart
Dollar/Yen is trading above the 109.00 handle and the 200-day simple moving average (DMA) on the daily time frame. The market is nearing the November highs. Breaking: US GDP, durables beat expectations, USD/JPY hits new highs.
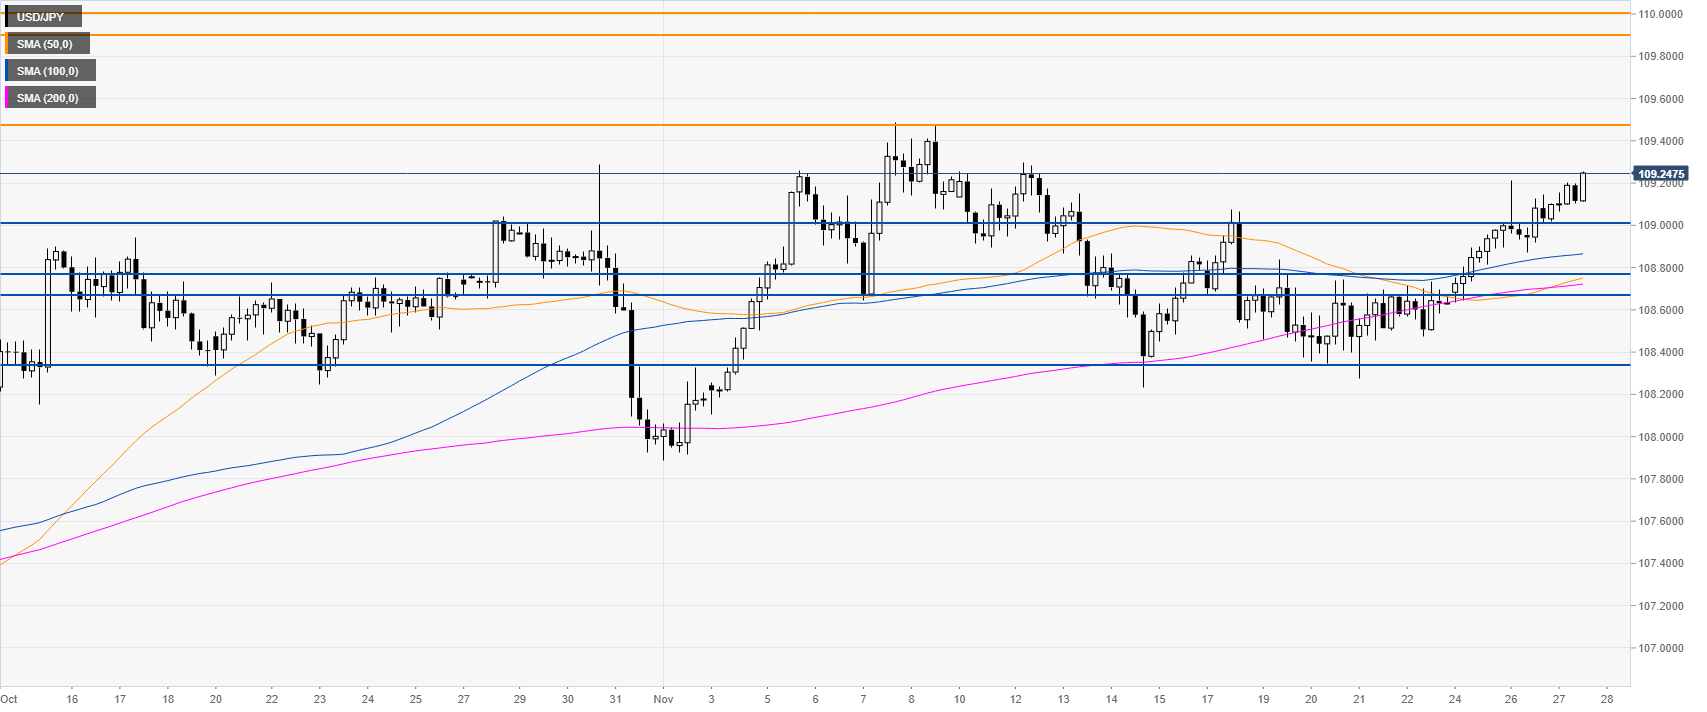
USD/JPY four-hour chart
The spot is trending up as the bulls might be headed toward the 109.46 level and the 109.92/110.00 resistance zone, according to the Technical Confluences Indicator.
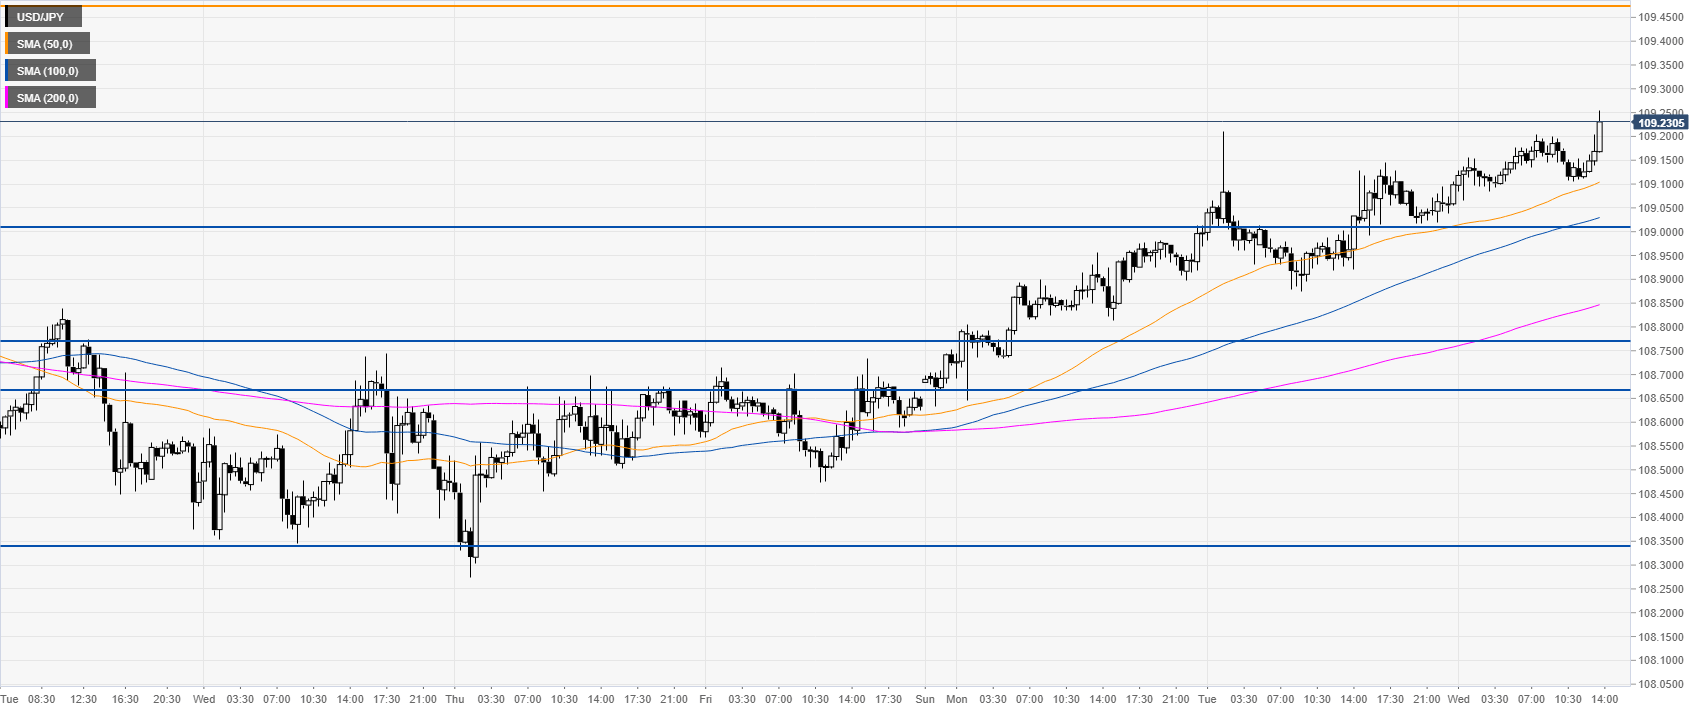
USD/JPY 30-minute chart
USD/JPY is trading above the main SMAs on the 30-minute chart suggesting bullish momentum. Support is seen at the 109.01 level, the 108.66/78 price zone and the 108.33 level, according to the Technical Confluences Indicator.
Additional key levels