Back
9 Dec 2019
EUR/USD price analysis: Euro erases most of the intraday gains, challenges the 1.1059 support
- EUR/USD is starting the week mixed while the market keeps weakening into the London close.
- The level to beat for sellers is the 1.1059 support.
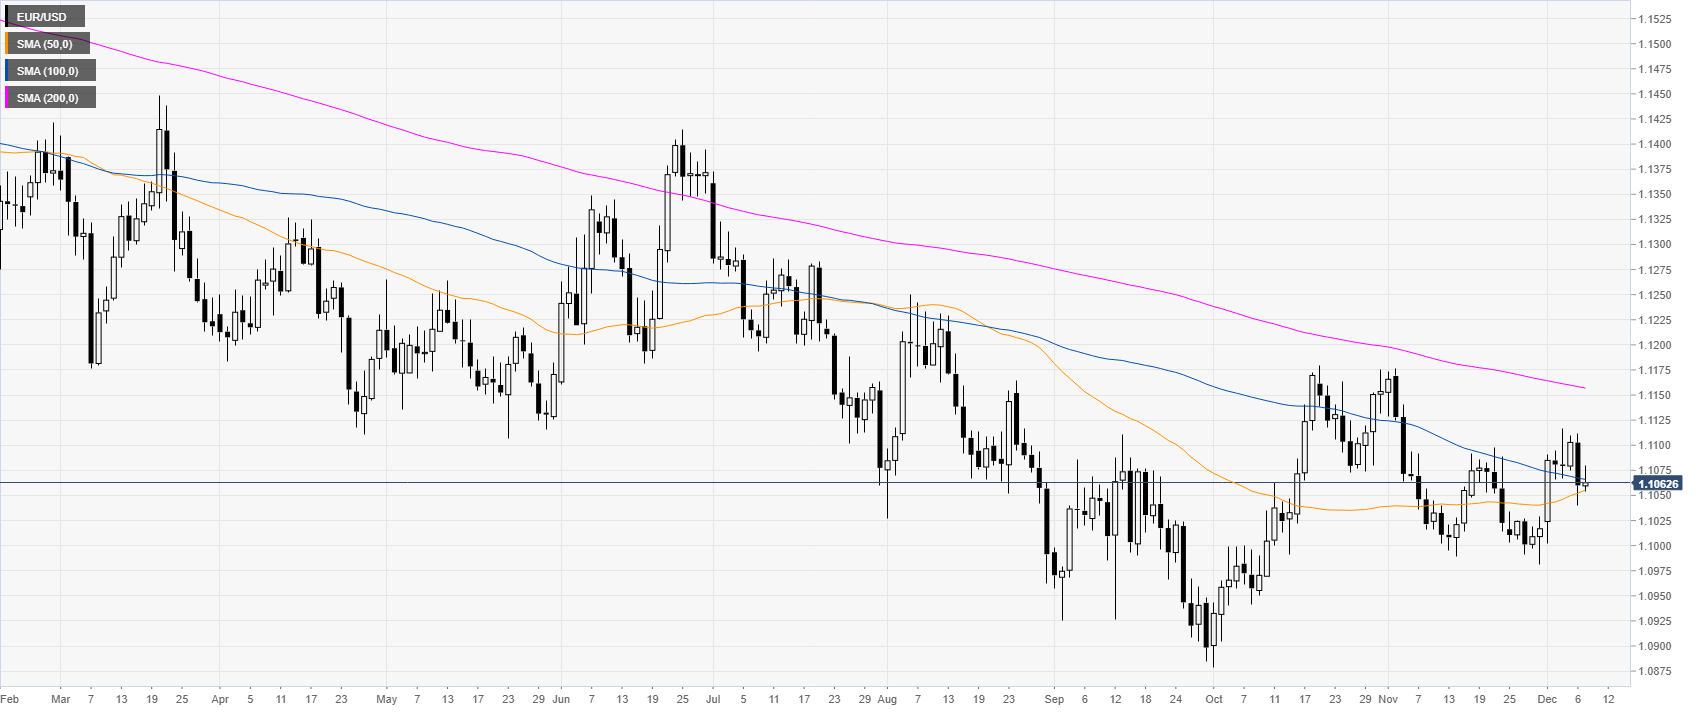
EUR/USD daily chart
The common currency, on the daily chart, is trading below its 200-day simple moving average (DMA). However, at the start of December, the spot had a strong bullish reversal. The sellers would likely need to have a daily close below the 1.1000 handle to restore a clear bearish bias.
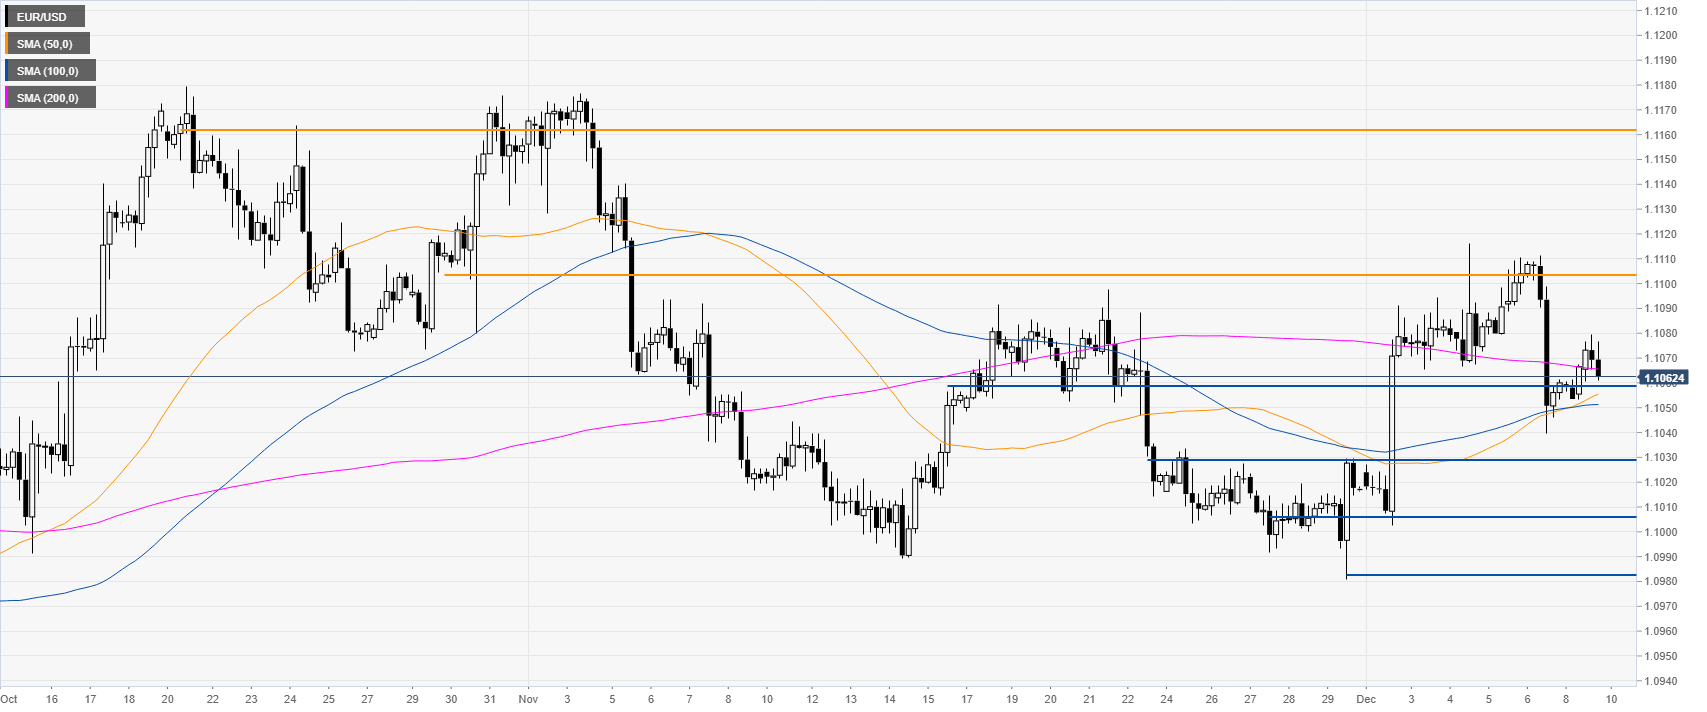
EUR/USD four-hour chart
EUR/USD are showing little conviction at the start of the week as the spot is battling with the 200 SMA on the four-hour chart. If bears manage to break below the 1.1059 level, the market could start to decline towards the 1.1030 and 1.1008 level. Further down lies the 1.0984 level, according to the Technical Confluences Indicator.
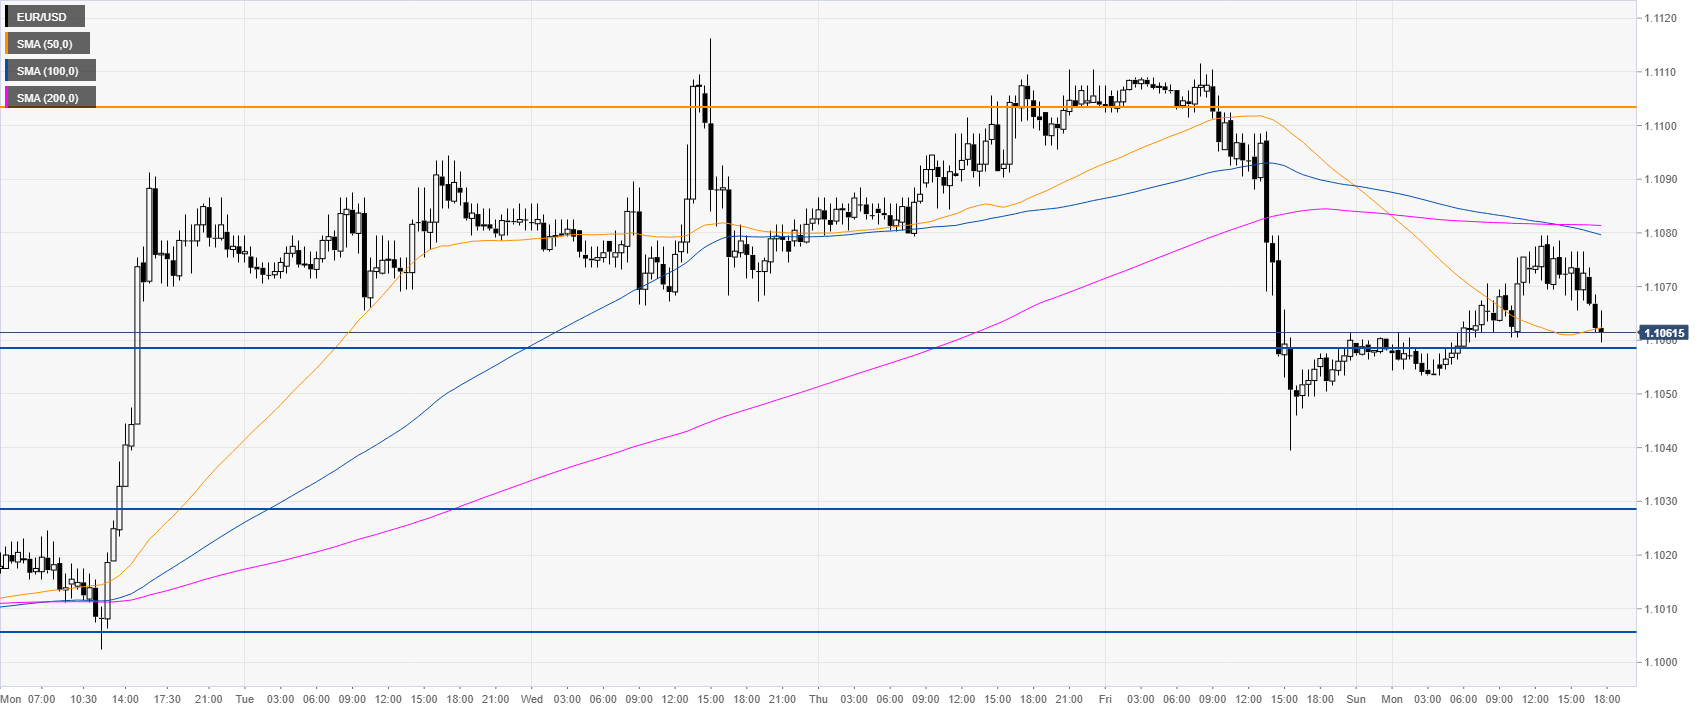
EUR/USD 30-minute chart
The euro is trading below the 100 and 200 SMA while nearing the session’s lows. Resistance is seen at the 1.1083 and 1.1105 price levels, according to the Technical Confluences Indicator.
Additional key levels