GBP/JPY Technical Analysis: Below 21-day SMA, 12-day-old trendline amid bearish MACD
- GBP/JPY recovers after Monday’s losses.
- 23.6% Fibonacci retracement, December 16 low adds to resistances.
- A confluence of 50-day SMA, 38.2% Fibonacci retracement limit immediate declines.
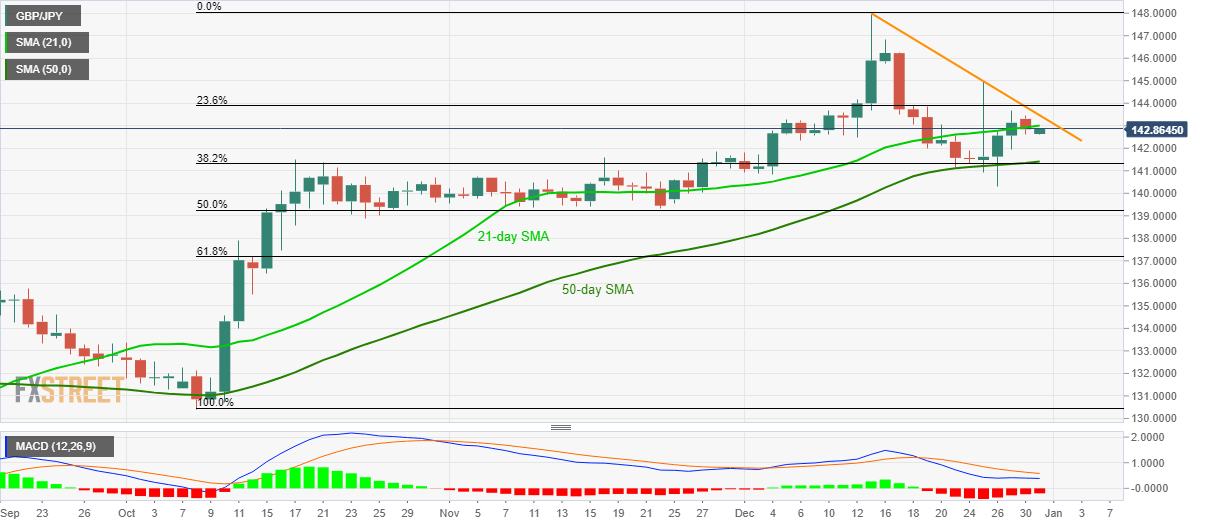
GBP/JPY takes the bids to 142.86 amid Tuesday’s Asian session. The pair needs to overcome key nearby technical resistances, not to forget bearish MACD, to justify the recent recovery.
21-day SMA around 143.00, followed by a downward sloping trend line since December 13, at 143.47 now, are likely immediate upside barriers for the pair traders to watch.
In a case where the quote rises beyond 143.50, December 16 low around 145.75 holds the key to additional run-up towards the monthly high close to 148.00.
Alternatively, 50-day SMA and 38.2% Fibonacci retracement of October low to mid-month top, around 141.30/40, can question sellers.
It’s worth mentioning that the monthly bottom around 140.30, 140.00 round figure and 50% Fibonacci retracement, at 139.25, will please the bears after 141.30.
GBP/JPY daily chart
Trend: Pullback expected