NZD/USD Technical Analysis: All eyes on 0.6783/92 supply zone after China PMI
- NZD/USD stays on the front foot as China’s manufacturing PMI stood beyond the 50.00 level for the second month.
- China’s December month PMIs suggest firm manufacturing contrasting to downbeat services activities.
- Highs marked in mid-April/July gain the Bulls’ attention.
Following the firm reading of China’s official manufacturing data, NZD/USD takes the bids to 0.6735 during early Tuesday.
Read: China's NBS Manufacturing PMI prints above 50 for the second month in a row
Given the absence of major data, coupled with the kiwi traders entering New Year’s Eve holiday, buyers will keep targeting an area including highs marked since April 12, near 0.6783/92, during the days to come.
Alternatively, a two-week-old rising trend line and 61.8% Fibonacci retracement of March-September fall, around 0.6660/55 offers strong downside support to the pair.
In a case where sellers conquer the near-term key support confluence, December 13 high near 0.6635 and 50% Fibonacci retracement around 0.6570 can please the sellers ahead of welcoming 200-day EMA level of 0.6533.
NZD/USD daily chart
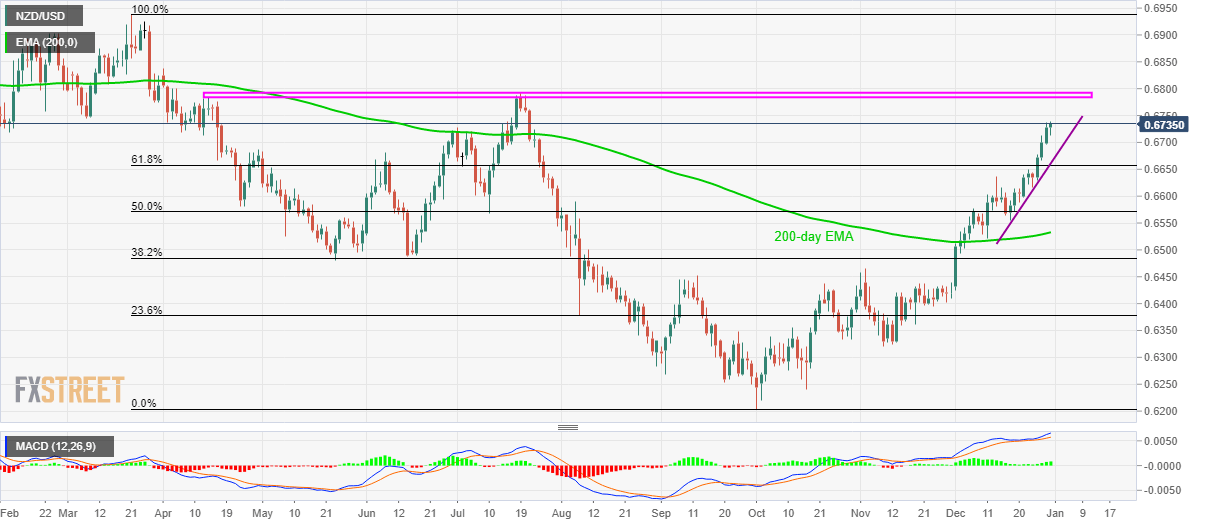
Trend: Bullish