Back
21 Jan 2020
USD/INR Price Analysis: Struggling to capitalize on breakout
- USD/INR's corrective bounce has likely ended, according to technical charts.
- The pair risks falling back to 70.80.
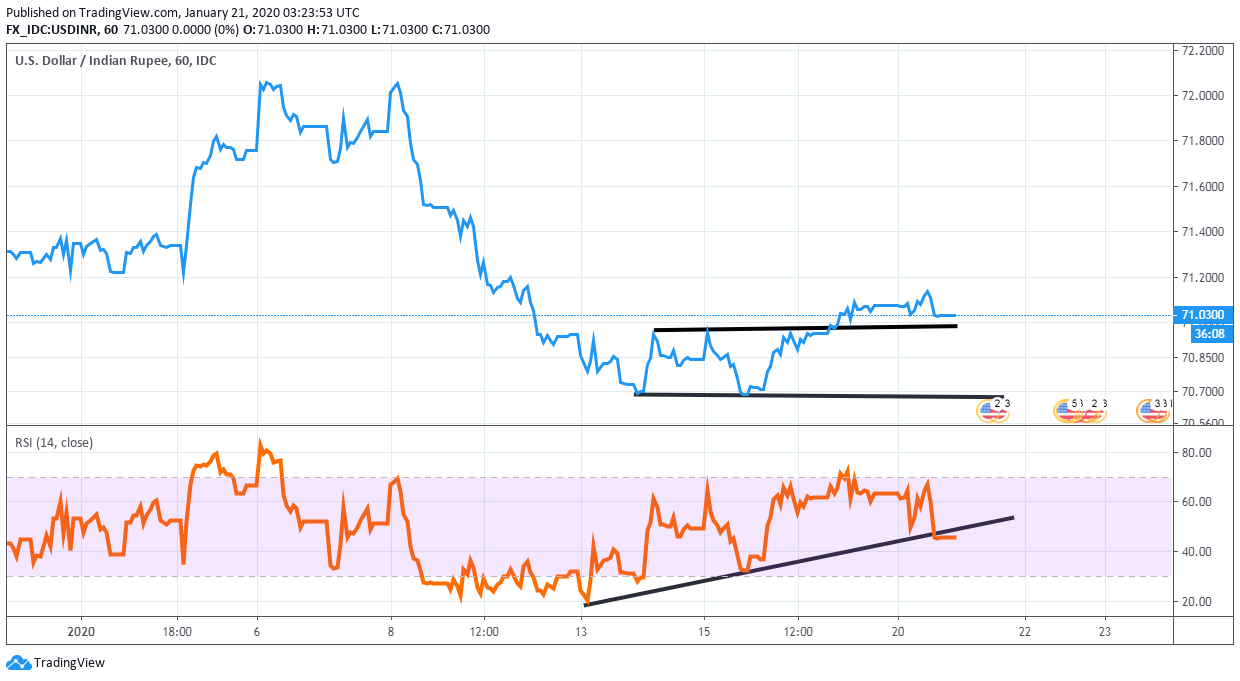
USD/INR broke higher from a sideways channel on Friday, but so far, the bulls have failed to make their presence felt.
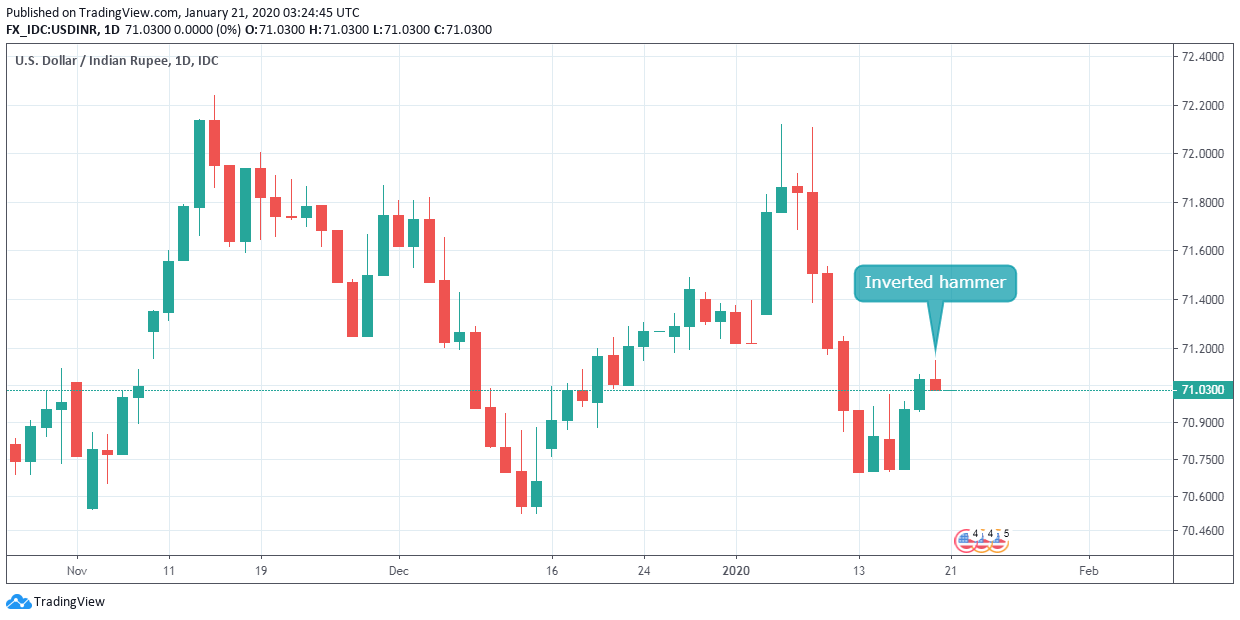
The currency pair fell by 0.10% on Monday, forming an inverted bearish hammer. That candle indicates the bounce from lows near 70.70 has likely ended.
Further, the relative strength index (RSI) on the hourly chart has dived out of an ascending trendline.
The pair, therefore, risks falling to support at 70.80. A violation there would expose the recent low of 70.67.
On the higher side, 71.15 is the level to beat for the bulls.
Hourly chart

Daily chart

Trend: Bearish
Technical levels
