Back
21 Jan 2020
EUR/USD Price Analysis: Euro formed head-and-shoulders pattern, nearing 1.1121 resistance
- EUR/USD had a failed bearish breakout below the 1.1098 level.
- Resistance is seen at the 1.1121 level and the correction can extend to 1.1151 resistance.
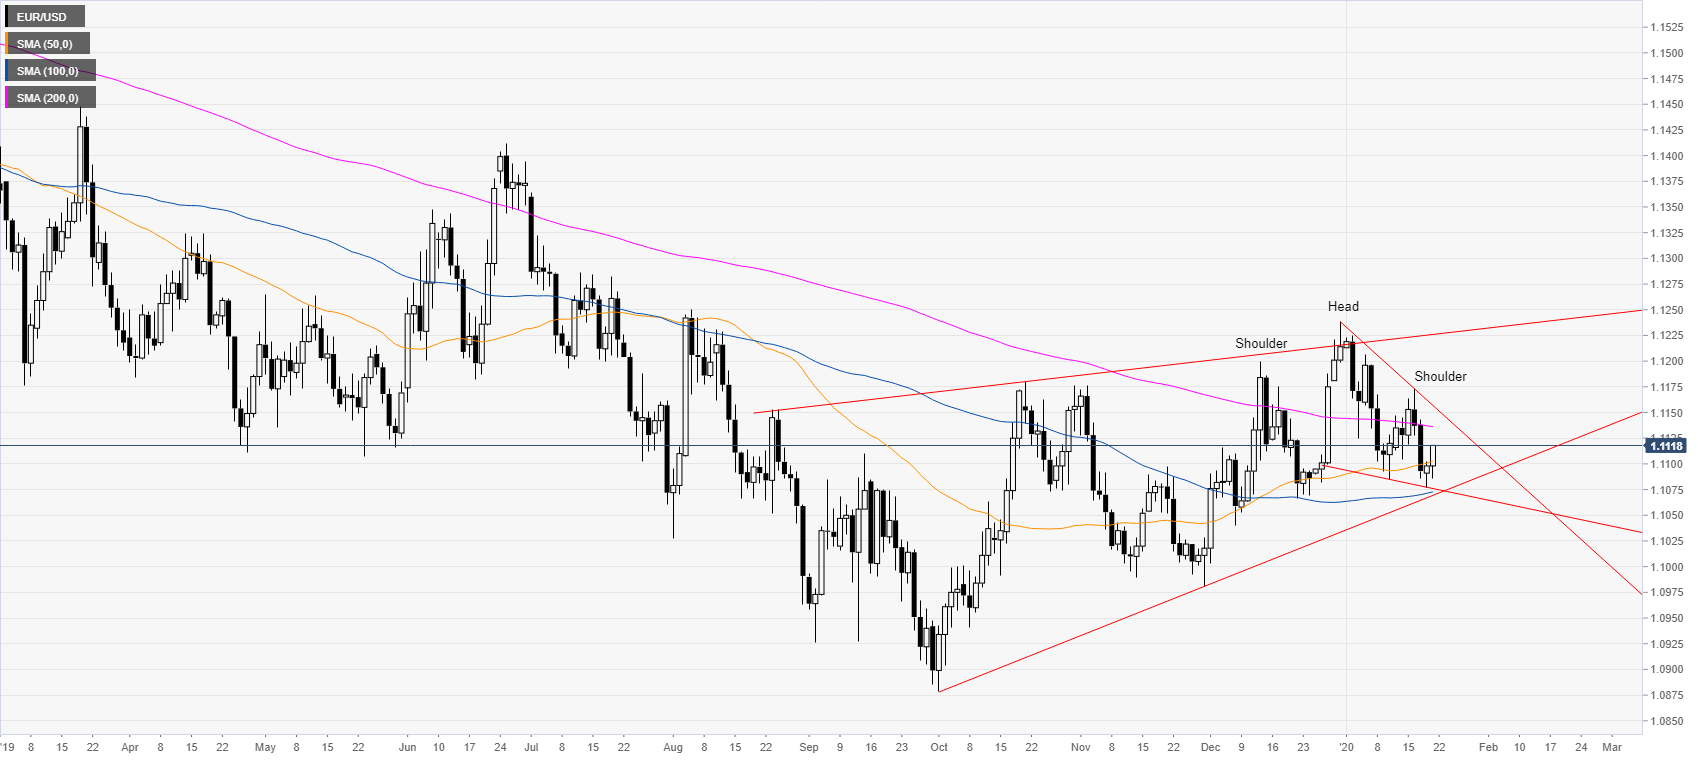
EUR/USD daily chart
EUR/USD is trading in a weak bear trend below its 200-day simple moving average (SMA). However, EUR/USD is trading within a bullish channel originating from October 2019 and also within a bull flag since late December. The euro formed a head-and-shoulders pattern, therefore, a break above the right shoulder near 1.1175 and the 200 SMA can be seen as a bullish continuation signal. However, since the price action has been so two-sided in the last months of trading it is more likely that breakouts in either direction will not go very far.
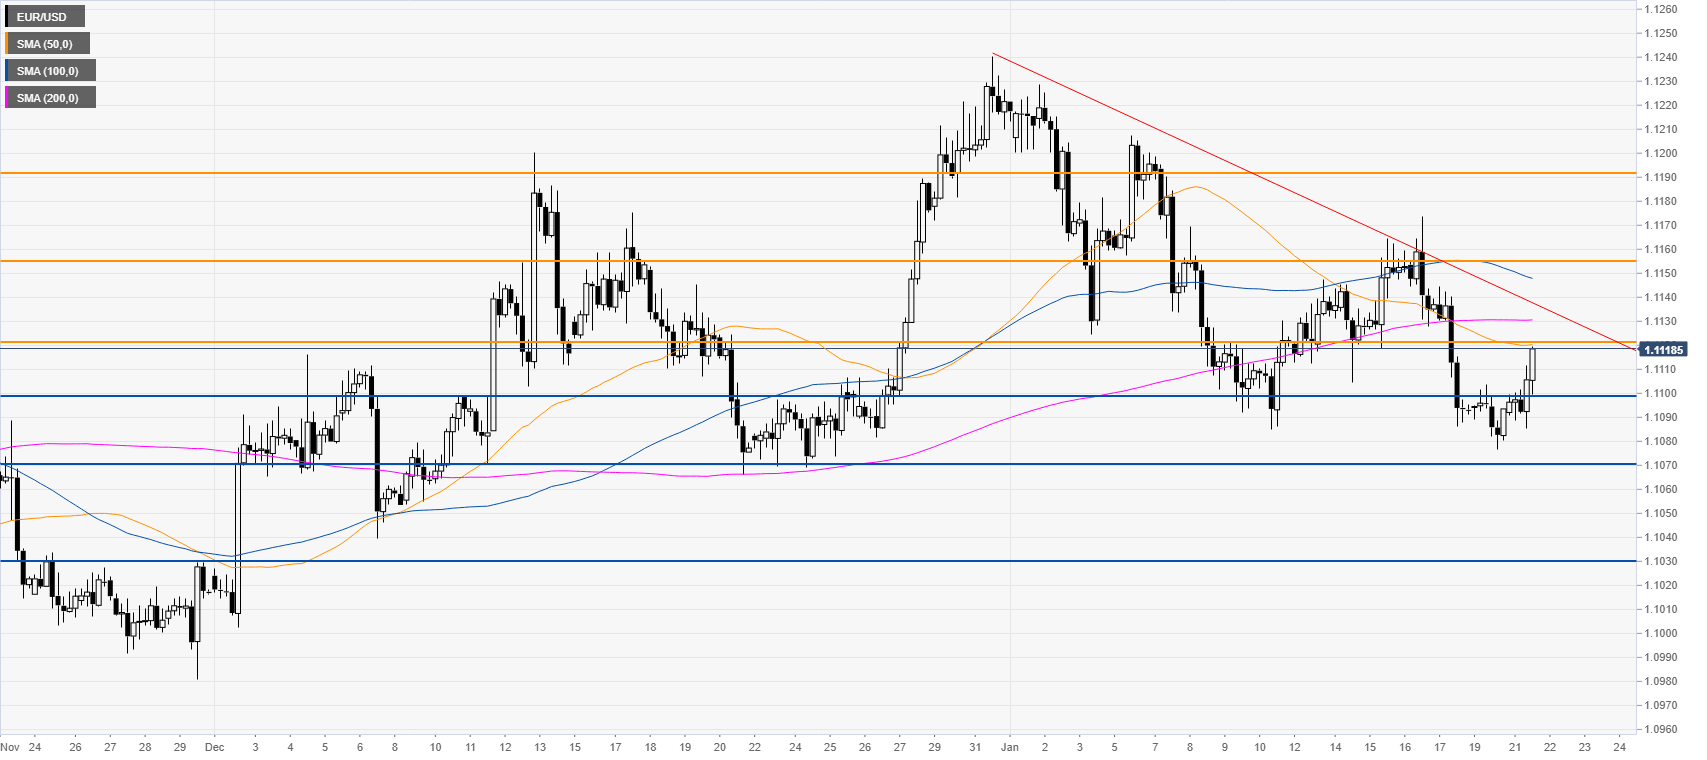
EUR/USD four-hour chart
The spot is trading below the main SMAs, suggesting an underlying bearish bias. At the start of the week, the market had a failed bearish breakout below the 1.1098 support level. The market is correcting up and if it breaks above the 1.1121 resistance the bounce can extend towards the 1.1155 resistance where it should find a potential stronger resistance. Further up lies the 1.1190 level. Support is seen at the 1.1098, 1.1070 and 1.1030 levels, according to the Technical Confluences Indicator.
Resistance: 1.1121, 1.1155, 1.1190
Support: 1.1098, 1.1070, 1.1030
Additional key levels