Confirming you are not from the U.S. or the Philippines

یہ بیان دے کر، میں واضح طور پر یہ بتاتا اور تصدیق کرتا ہوں کہ:
  • میں امریکی شہری یا رہائشی نہیں ہوں
  • میں فلپائن کا رہائشی نہیں ہوں
  • میں بالواسطہ یا بلاواسطہ امریکی باشندوں کے 10 فیصد سے زیادہ شیئرز/ ووٹنگ کا حق/ امریکی باشندوں کے انٹرسٹ کا مالک نہیں ہوں اور/یا دوسرے ذرائع سے امریکی شہریوں یا رہائشیوں کو کنٹرول نہیں کرتا ہوں۔
  • میں بالواسطہ یا بلاواسطہ امریکی باشندوں کے 10 فیصد سے زیادہ شیئرز/ ووٹنگ کا حق/ انٹرسٹ کا مالک نہیں ہوں اور/ یا کسی دوسرے ذریعے سے امریکی شہری یا رہائشی کے کنٹرول میں نہیں ہوں۔
  • میں FATCA کے سیکشن (a)1504 کے معاملے میں امریکی شہریوں یا رہائشیوں کے ساتھ وابستہ نہیں ہوں
  • میں غلط اعلان کرنے پر اپنی ذمہ داری سے واقف ہوں۔
اس بیان کے مقاصد کے لئے، ریاستہائے متحدہ امریکہ کے تمام منحصر ممالک اور علاقوں کو امریکہ کے مرکزی علاقے کے برابر کردیا گیا ہے۔ میں اپنے اس بیان کی خلاف ورزی سے پیدا ہونے یا اس سے متعلق ہونے والے کسی بھی دعوے کے خلاف، بے ضرر آکٹا مارکیٹس انکارپوریٹڈ، اس کے ڈائریکٹرز اور افسران کا دفاع کرنے کا عہد کرتا ہوں۔
ہم آپ کی رازداری اور آپ کی ذاتی معلومات کے تحفظ کے لیے وقف ہیں۔ ہم محض اپنی پراڈکٹس اور سروسز کے متعلق خصوصی پیشکشوں اور اہم معلومات فراہم کرنے کے لیے ای میلز اکٹھا کرتے ہیں۔ اپنا ای میل ایڈریس دے کر، آپ ہم سے ایسے ای میلز وصول کرنے پر اتفاق کرتے ہیں۔ اگر آپ انسبسکرائب کرنا چاہتے ہیں یا کوئی سوالات یا خدشات ہوں تو، ہماری کسٹمر سپورٹ کو لکھیں۔
Octa trading broker
ٹریڈنگ اکاؤنٹ کھولیں
Back

USD/CAD Price Analysis: 1.3200 becomes the tough nut to crack for buyers

  • The eight-week-old falling trend line, 61.8% Fibonacci retracement guard the pair’s near-term upside.
  • Sustained break of 50-day SMA propels the quote to 100-day SMA.
  • The early-month top could challenge sellers during the pullback.

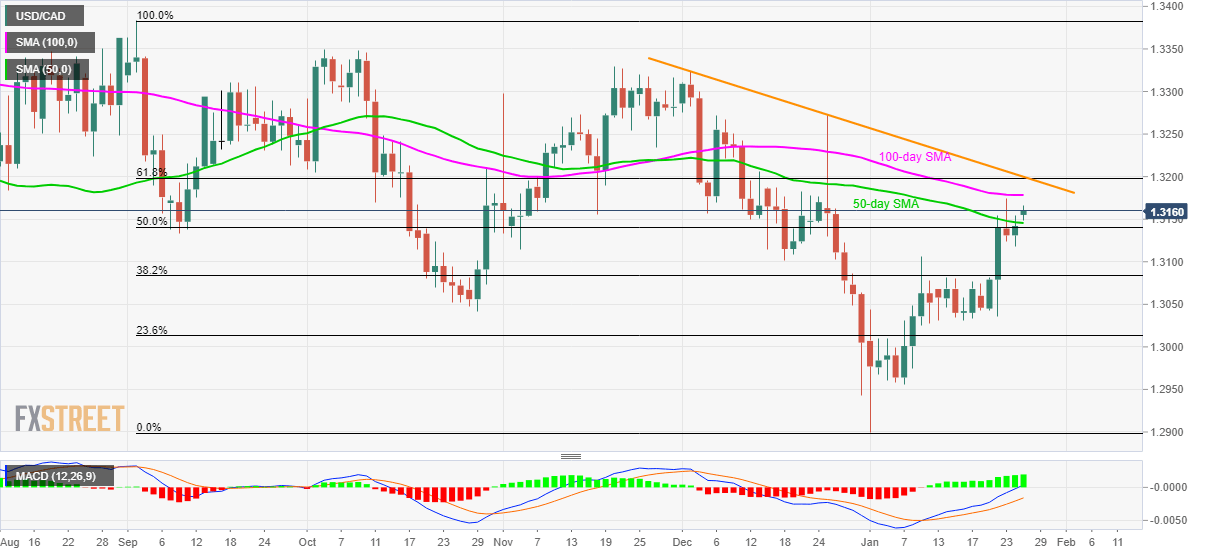
USD/CAD takes the bids to 1.3160 while heading into the European open on Monday. The pair recently crossed 50-day SMA for the first time since early-December. With this, prices are likely to confront 100-day SMA.

Even so, a confluence of a multi-week-old resistance line from December 03 and 61.8% Fibonacci retracement of the pair’s September 2019 to January 01 declines can challenge the bulls around 1.3200.

Should buyers concentrate more on the bullish MACD signals and cross 1.3200 on a daily closing basis, December month’s high near 1.3320 will return to the charts.

Alternatively, 50-day SMA and 50% Fibonacci retracement could restrict the pair’s immediate declines near 1.3145/40, a break of which could push the quote towards January 09 top near 1.3105.

During the pair’s south-run post-1.3105, also below 1.3100 round-figure, multiple stops around 1.3080 can question the bears targeting 1.3030 and 1.3000 psychological mark.

USD/CAD daily chart

Trend: Pullback expected


GBP/USD registers three-day losing streak with eyes on BOE, Brexit

GBP/USD stays on the back foot while declining to 1.3060 ahead of the London open on Monday. The pair bears the burden of Brexit anxiety and fears of
مزید پڑھیں Previous

UK’s Barclay: UK will set out EU trade objectives next month

While speaking on BBC television’s Andrew Marr program Sunday, the UK Brexit Secretary Barclay said the Kingdom will outline more details about its ob
مزید پڑھیں Next