Back
21 Feb 2020
USD/INR New York Price Forecast: Dollar advances vs. rupee, challenges 72.00 figure
- USD/INR is trading at levels last seen in early January.
- The level to beat for buyers is the 72.00 resistance.
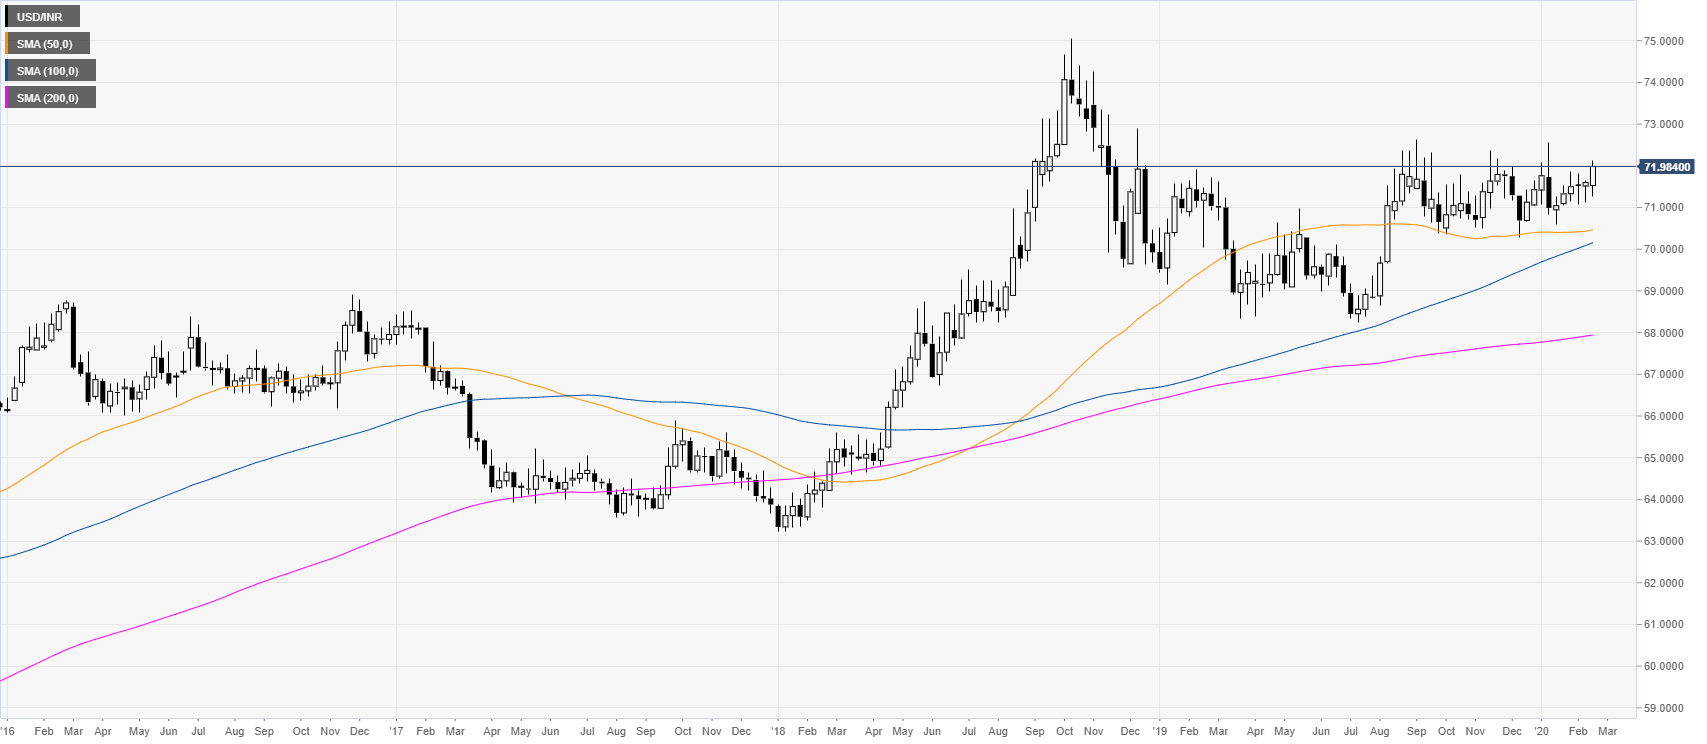
USD/INR weekly chart
After the 2018 bull-market, the USD/INR has been consolidating in a rectangle formation. The spot is trading above its main weekly simple moving averages (SMAs), suggesting a bullish momentum in the long term.
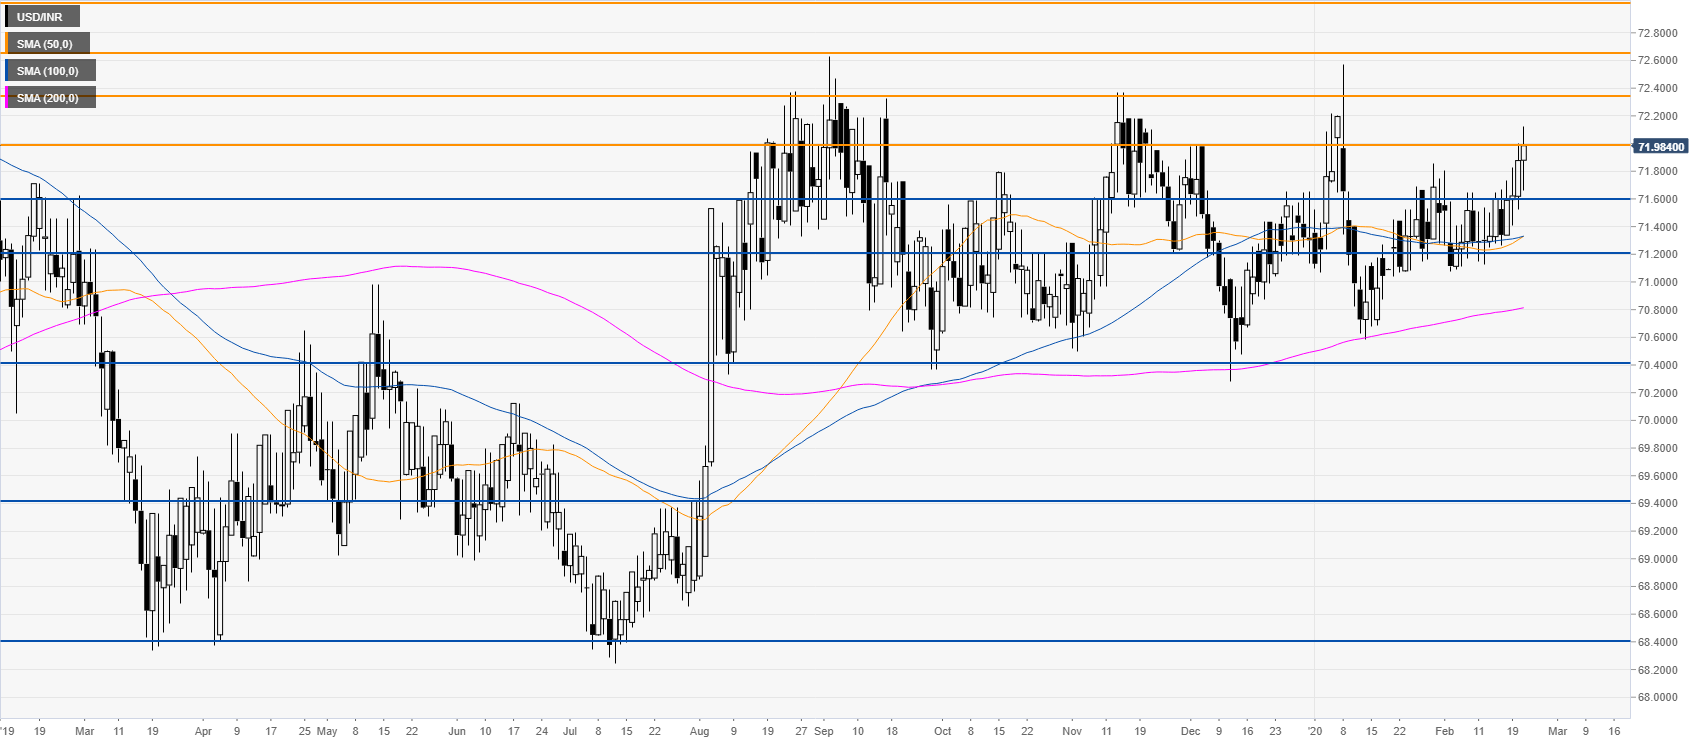
USD/INR daily chart
USD/INR is rising to six-week highs while challenging the 72.00 figure. Bulls want a weekly close above the 72.00 level in order to target higher levels near 72.35 and 72.66. Support is seen near 71.60 and 71.20 levels.
Additional key levels