Back
27 Feb 2020
AUD/USD Price Analysis: Aussie gets small rebound from one-decade low
- AUD/USD rebounds modestly from one-decade low.
- A bullish correction up cannot be ruled out.
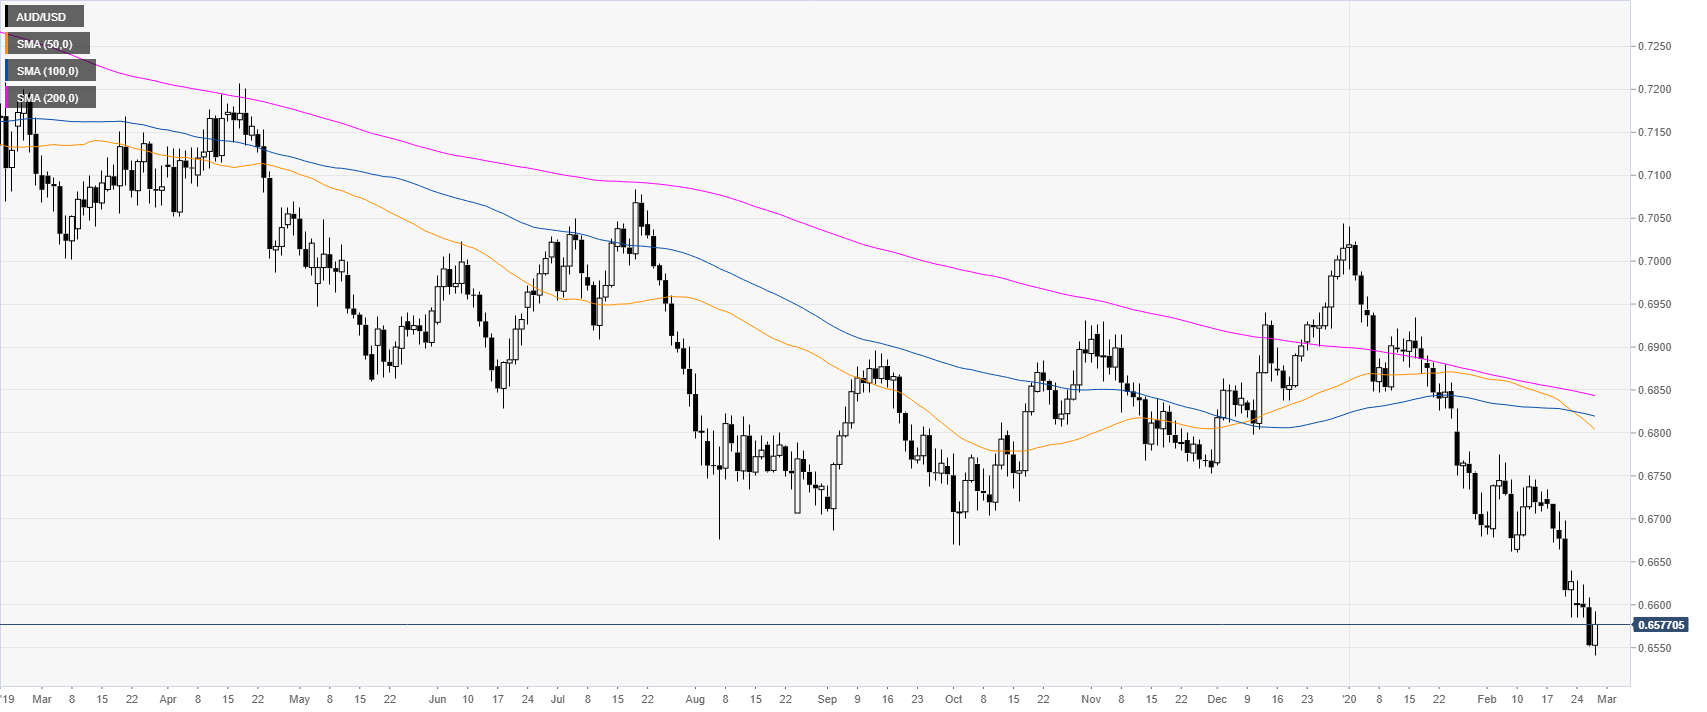
AUD/USD daily chart
AUD/USD is hovering near one-decade lows while trading well below its main daily simple moving averages (SMAs).
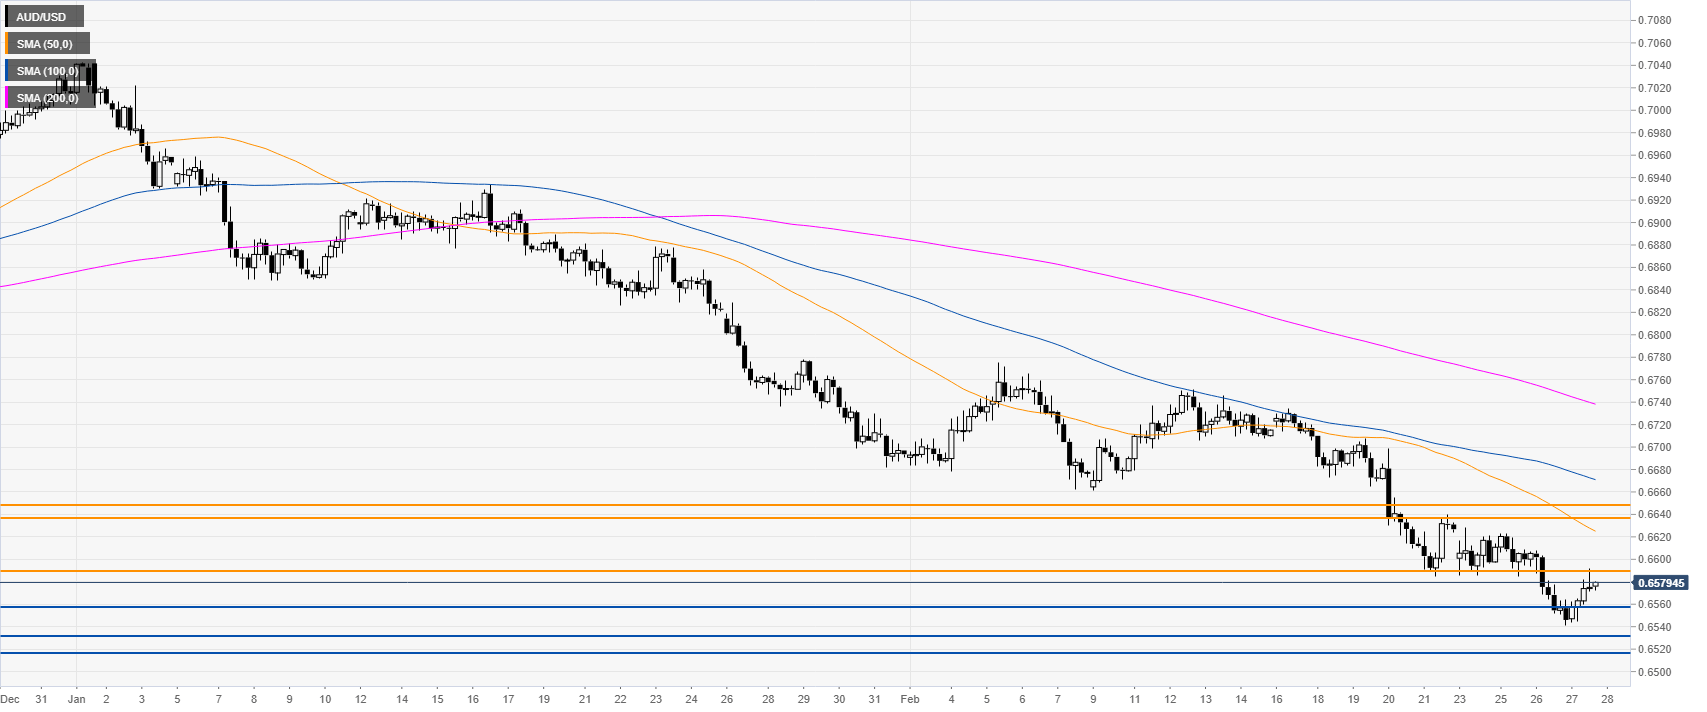
AUD/USD four-hour chart
The trend is bearish, however, as USD is losing steam a bullish correction cannot be ruled out. A break beyond the 0.6587 level could attract buying interest towards the 0.6635 and 0.6759 levels. Support is seen near 0.6560 and 0.6532 levels, according to the Technical Confluences Indicator.
Resistance: 0.6587, 0.6635, 0.6649
Support: 0.6560, 0.6532, 0.6520
Additional key levels