Back
28 Jul 2020
US Dollar Index Price Analysis: Interim resistance emerges around 94.20
- DXY recovers some ground lost after Monday’s pullback to 93.50.
- The Fibo level at 94.20 emerges on the short-term horizon.
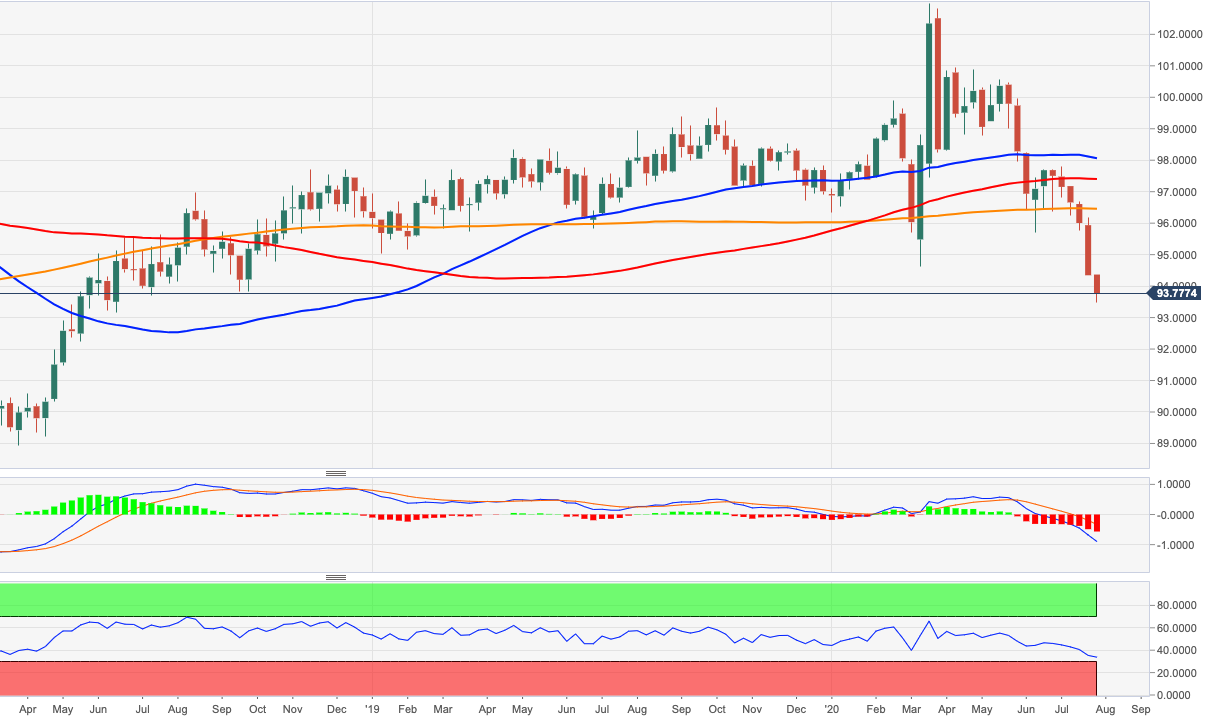
The sell-off in DXY has reached levels last seen in June 2018 near 93.50 at the beginning of the week, leaving the bearish view on the index intact in the near-term. The current recovery carries the potential to extend to the Fibo level at 94.20, as the index pushes higehr from recent oversold levels.
In fact, further downside is increasingly likely in the current atmosphere, allowing for a probable move and test of the June 2018 lows near 93.20. Further south aligns the May 2018 low at 91.80.
The negative outlook on the dollar is expected to remain unaltered while below the 200-day SMA, today at 98.09.
DXY weekly chart