Gold Price Analysis: XAU/USD eases from $1,911/12 resistance confluence
- Gold fades upside momentum while stepping back from the intraday high of $1,910.72.
- 200-bar EMA, 50% Fibonacci retracement of September’s downside limit immediate upside.
- Three-week-old support line restricts short-term declines below the $1,900 threshold.
Gold prices drop to $1,906.55, down 0.10% intraday, during early Friday. The bullion previously surged to Wednesday’s high but couldn’t clear a joint of the key EMA and Fibonacci retracement level.
However, normal RSI conditions and sustained trading above an ascending trend line from September 24 keeps the metal buyers hopeful.
As a result, the October 06 high near $1,921, followed by the 61.8% of Fibonacci retracement around $1,926 can pop-up on the gold bull’s radar after clearing the $1,911-12 immediate upside hurdle.
It should, however, be noted that the quote’s upside past-$1,926 will be questioned by the $1,932-33 area comprising late-September lows and the current month’s high.
Meanwhile, the $1,900 round-figure may entertain the intraday sellers ahead of probing them with a nearby rising support line, close to $1,891.
Though, a sustained break below $1,891 will make the gold prices vulnerable to plunge towards the monthly bottom around $1,873.
Gold four-hour chart
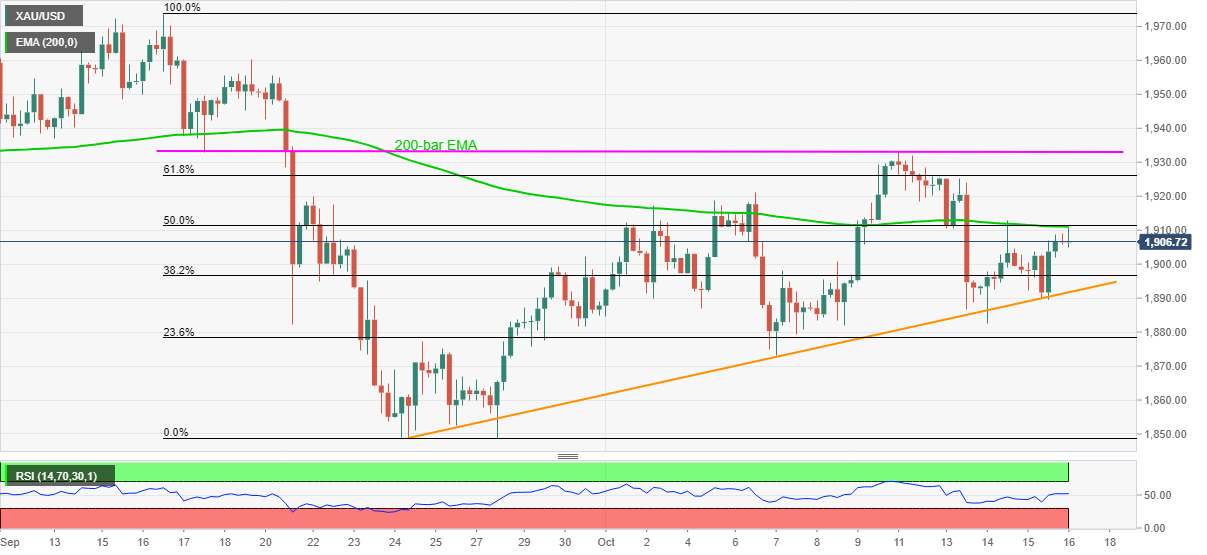
Trend: Further upside expected