Confirming you are not from the U.S. or the Philippines

یہ بیان دے کر، میں واضح طور پر یہ بتاتا اور تصدیق کرتا ہوں کہ:
  • میں امریکی شہری یا رہائشی نہیں ہوں
  • میں فلپائن کا رہائشی نہیں ہوں
  • میں بالواسطہ یا بلاواسطہ امریکی باشندوں کے 10 فیصد سے زیادہ شیئرز/ ووٹنگ کا حق/ امریکی باشندوں کے انٹرسٹ کا مالک نہیں ہوں اور/یا دوسرے ذرائع سے امریکی شہریوں یا رہائشیوں کو کنٹرول نہیں کرتا ہوں۔
  • میں بالواسطہ یا بلاواسطہ امریکی باشندوں کے 10 فیصد سے زیادہ شیئرز/ ووٹنگ کا حق/ انٹرسٹ کا مالک نہیں ہوں اور/ یا کسی دوسرے ذریعے سے امریکی شہری یا رہائشی کے کنٹرول میں نہیں ہوں۔
  • میں FATCA کے سیکشن (a)1504 کے معاملے میں امریکی شہریوں یا رہائشیوں کے ساتھ وابستہ نہیں ہوں
  • میں غلط اعلان کرنے پر اپنی ذمہ داری سے واقف ہوں۔
اس بیان کے مقاصد کے لئے، ریاستہائے متحدہ امریکہ کے تمام منحصر ممالک اور علاقوں کو امریکہ کے مرکزی علاقے کے برابر کردیا گیا ہے۔ میں اپنے اس بیان کی خلاف ورزی سے پیدا ہونے یا اس سے متعلق ہونے والے کسی بھی دعوے کے خلاف، بے ضرر آکٹا مارکیٹس انکارپوریٹڈ، اس کے ڈائریکٹرز اور افسران کا دفاع کرنے کا عہد کرتا ہوں۔
ہم آپ کی رازداری اور آپ کی ذاتی معلومات کے تحفظ کے لیے وقف ہیں۔ ہم محض اپنی پراڈکٹس اور سروسز کے متعلق خصوصی پیشکشوں اور اہم معلومات فراہم کرنے کے لیے ای میلز اکٹھا کرتے ہیں۔ اپنا ای میل ایڈریس دے کر، آپ ہم سے ایسے ای میلز وصول کرنے پر اتفاق کرتے ہیں۔ اگر آپ انسبسکرائب کرنا چاہتے ہیں یا کوئی سوالات یا خدشات ہوں تو، ہماری کسٹمر سپورٹ کو لکھیں۔
Octa trading broker
ٹریڈنگ اکاؤنٹ کھولیں
Test
Back

Gold Price Analysis: Overbought RSI probes XAU/USD bulls at eight week tops above $1,900

  • Gold prices ease from the multi-day high as US dollar marks corrective pullback.
  • Risks dwindle amid virus woes, mixed prints of December’s activity numbers in Asia.
  • Sustained upside break of short-term triangle favor buyers.

Gold prices trim early Asian gains while receding to $1,921.67, up 1.21% intraday, ahead of Monday’s European session. The yellow metal jumped to its highest since November 09 during early trading hours before stepping back from $1,925.38.

While overbought RSI and the latest pullback in the US dollar index (DXY) could be traced as the triggers for the recent weakness in gold prices, the commodity’s ability to stay beyond a symmetrical triangle from December 16 keeps buyers hopeful.

However, odds of witnessing a pullback to the $1,900 and the resistance line of the stated triangle near $1,893, followed by the triangle support line, at $1,881 now, can’t be ruled out.

In a case where gold sellers conquer a 200-bar SMA level of $1,852.50, short-term horizontal support near $1,820 will be in the spotlight.

Alternatively, an ascending trend line from December 08, at $1,933 now, can offer an intermediate halt during the run-up to November highs near $1,966.

Overall, the risks are changing the course of early-Asian move amid the coronavirus (COVID-19) headlines and ahead of PMI data. However, any strong indicator is yet absent and hence traders may keep their eyes on macro for fresh impulse while cheering the technical breakout.

Gold four-hour chart
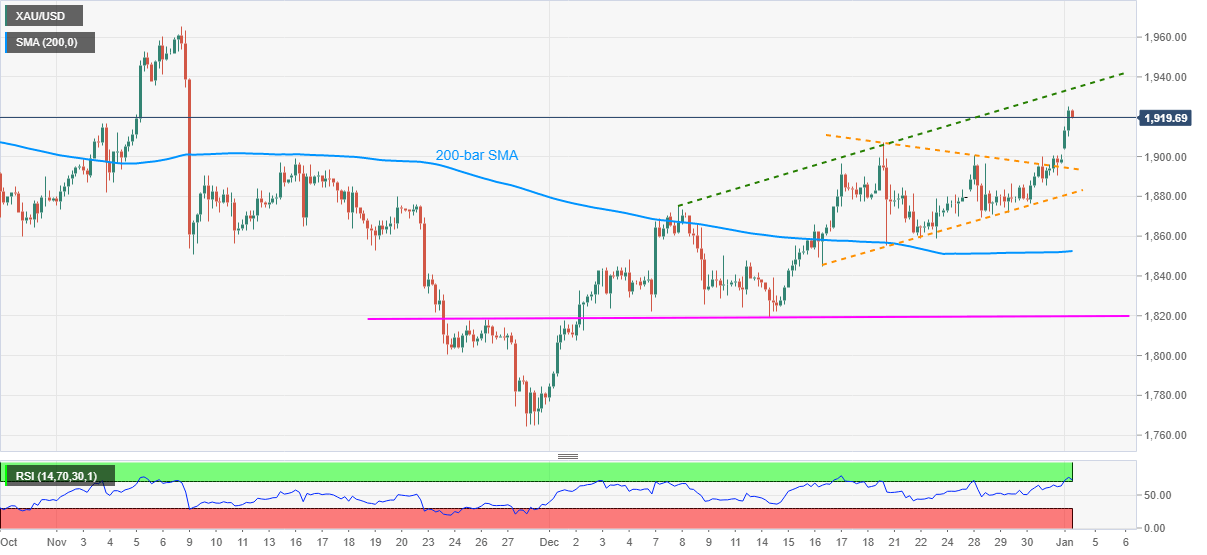
Trend: Bullish


GBP/USD now looks to 1.3750 – UOB

Cable remains firm and could advance to the mid-1.3700s in the short-term horizon, according to FX Strategists at UOB Group. Key Quotes 24-hour view:
مزید پڑھیں Previous

Crude Oil Futures: Extra upside not ruled out

In light of preliminary readings from CME Group for crude oil futures markets, investors added around 10.5K contracts to their open interest positions
مزید پڑھیں Next