US Dollar Index Price Analysis: DXY eyes further losses towards 50-DMA
- DXY remains on the back foot around intraday low, down for the fourth consecutive day.
- Clear downside break of 13-day-old support line keeps sellers hopeful.
- Bulls need to cross 10-week-long horizontal area to regain the controls.
US Dollar Index (DXY) holds lower ground near 96.25, prints a four-day downtrend during early Wednesday.
In doing so, the greenback gauge justifies the previous day’s downside break of a short-term support line, as well as steady RSI.
As a result, the US Dollar Index signals further downside towards the 50-SMA level of 96.08. However, the quote’s further weakness will be challenged by the 96.00 threshold.
Should the DXY bears manage to conquer the 96.00 round figure, multiple lows marked since November 18 will challenge additional downside around 95.60-50.
Meanwhile, the support-turned-resistance line from January 14 will challenge the pair’s immediate recovery moves near 96.75.
Following that, a horizontal area from November 24 and January 28 low, respectively around 96.95 and 97.05, will be crucial to watch for the US Dollar Index bulls.
DXY: Daily chart
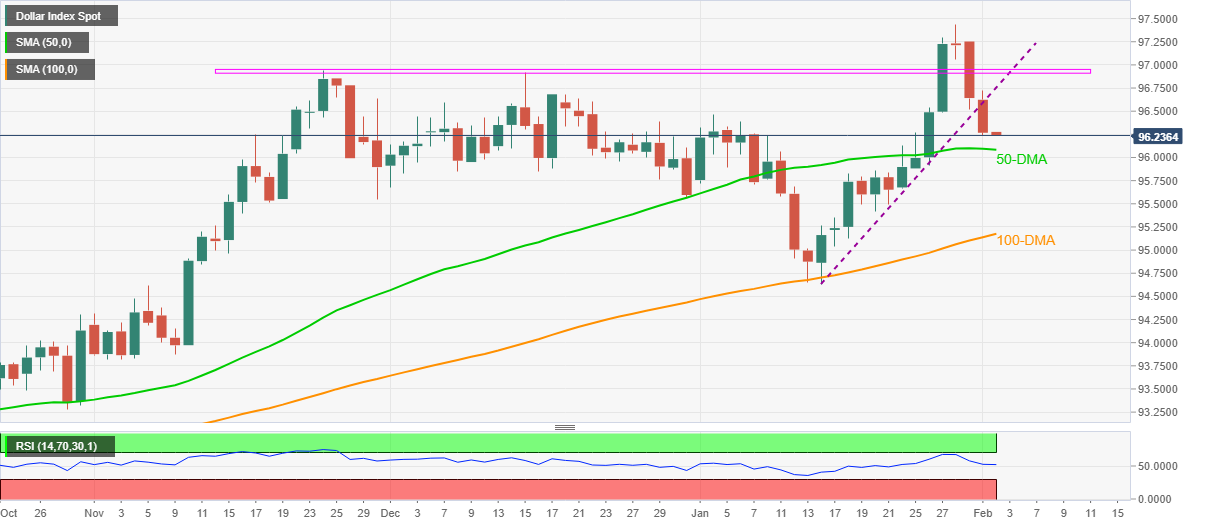
Trend: Further weakness expected