NZD/USD Price Analysis: Bulls eye a 61.8% golden ratio in the 0.67 area
- NZD/USD bulls stay in control and target higher levels still.
- The daily and weekly M-formations are compelling and have a confluence of Fibos that align with structure.
As per the prior session's analysis for NZD/USD, NZD/USD Price Analysis: Traders await RBA volatility to decipher the code in the market structure, the bird took flight as expected and has moved in towards a critical area on the longer-term charts as follows:
NZD/USD prior analysis
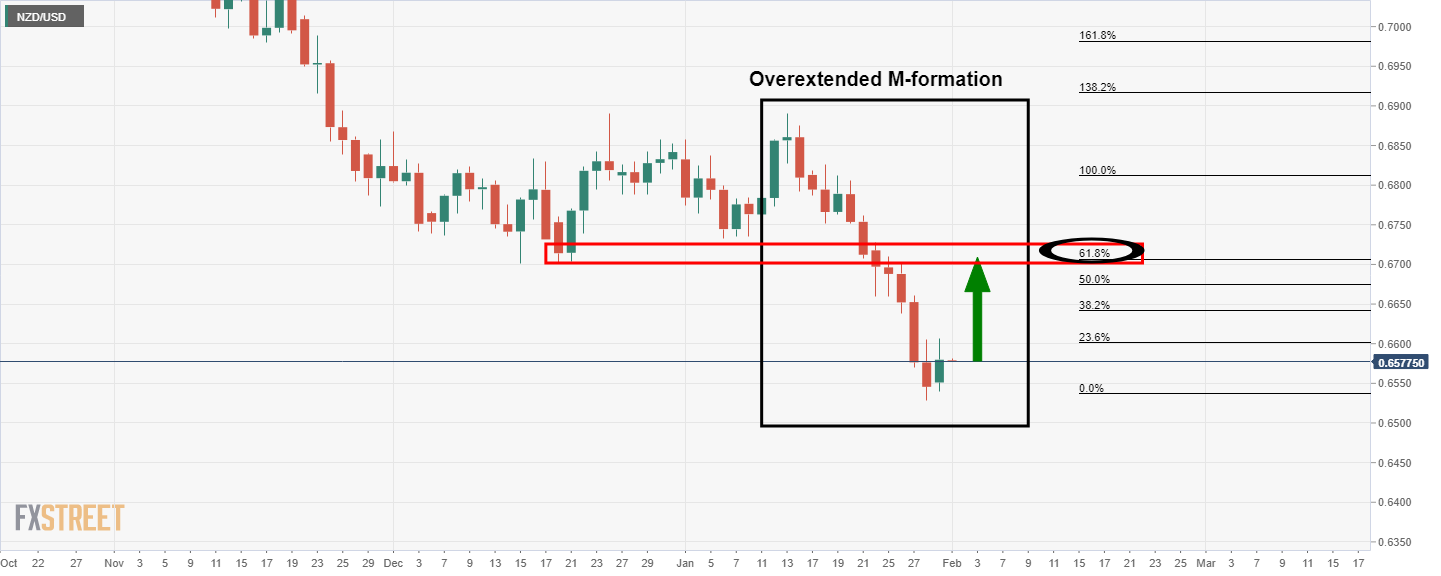
It was explained that the M-formation is overextended, but it is a reversion pattern nevertheless and the price would be expected to correct towards the 61.8% Fibonacci retracement level over the course of the coming days.
NZD/USD live market
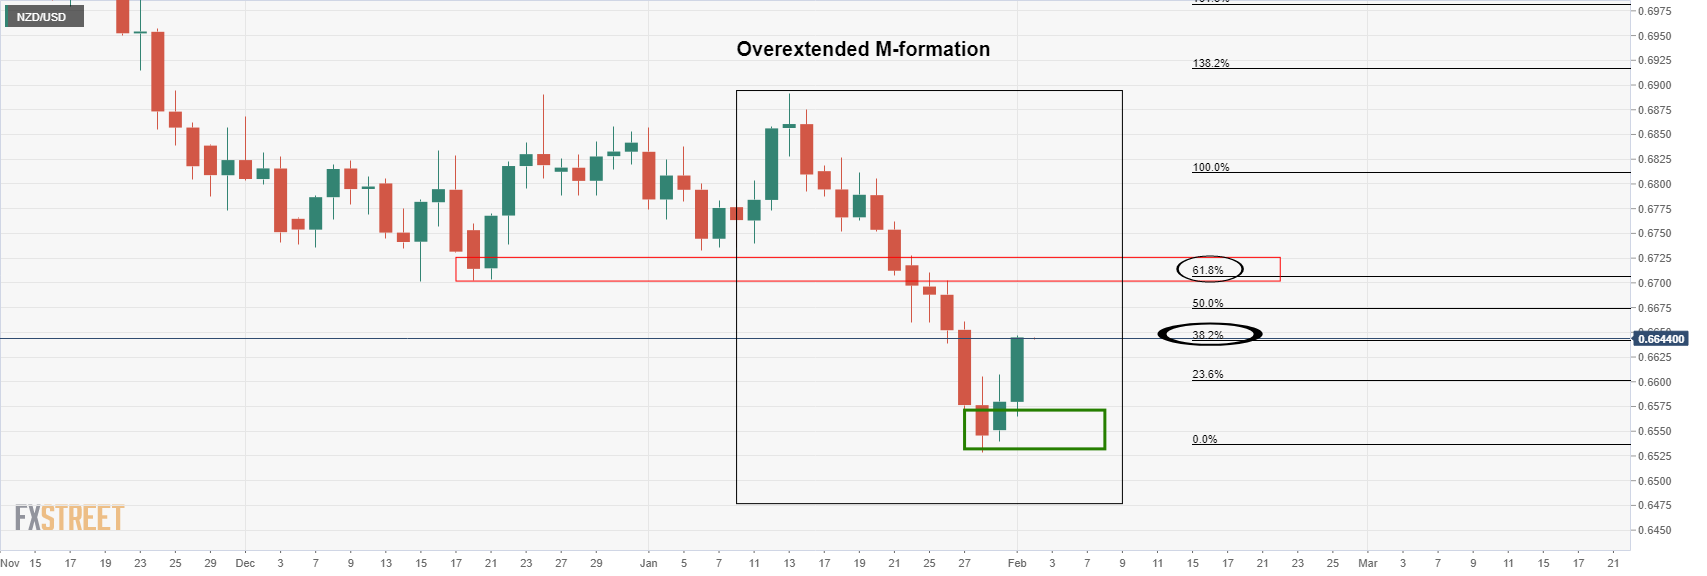
The price has rallied into the 38.2% Fibonacci retracement level o the way to the presumed target area near the 61.8% ratio. The weekly chart offers additional confluence as follows:
NZD/USD weekly chart
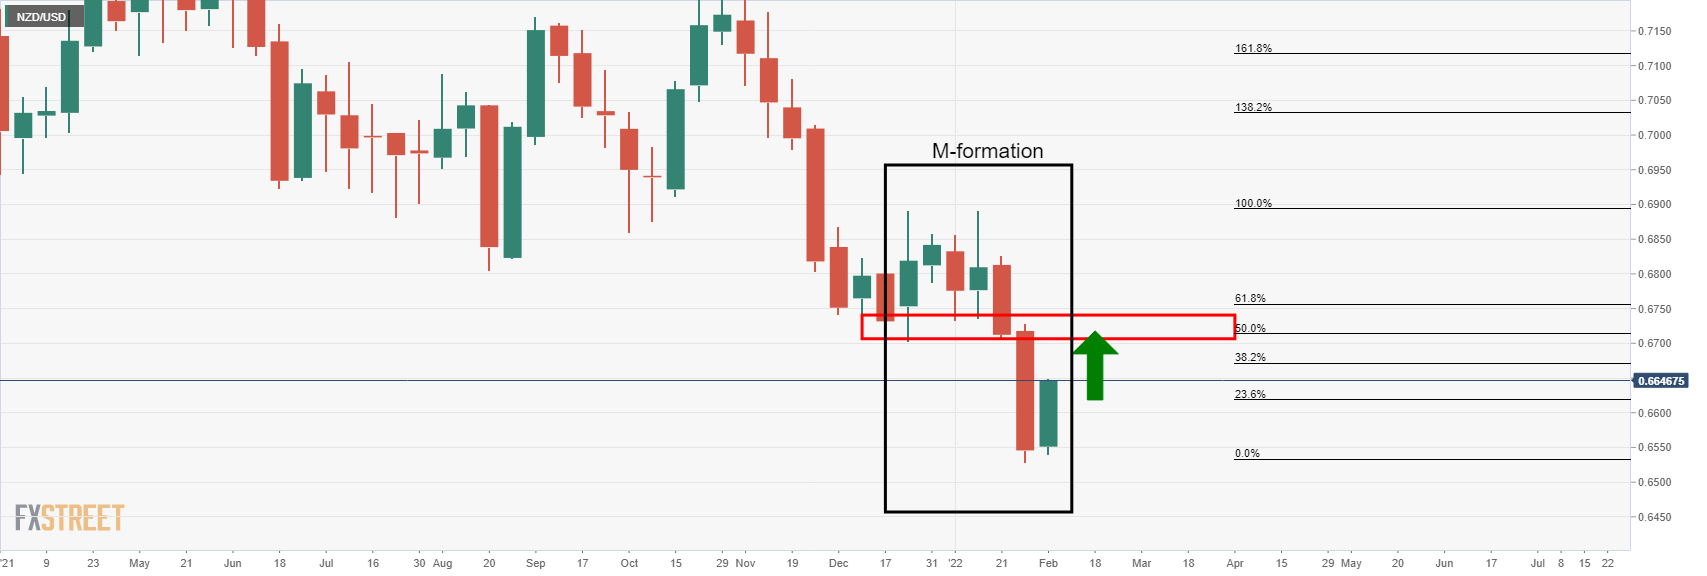
A 50% mean reversion of the weekly bearish leg of its own M-formation aligns with the daily target in the low 0.67 area.