WTI Price Analysis: Crosses weekly resistance with eyes on $111.30
- WTI prints three-day uptrend, grinds higher after piercing short-term key hurdle.
- Firmer RSI conditions, sustained trading beyond 50-HMA strength bullish bias.
- Buyers need validation from $111.30 to challenge monthly high.
WTI crude oil remains on the front foot for the third consecutive day, edging high around $110.35 during early Monday morning in Europe.
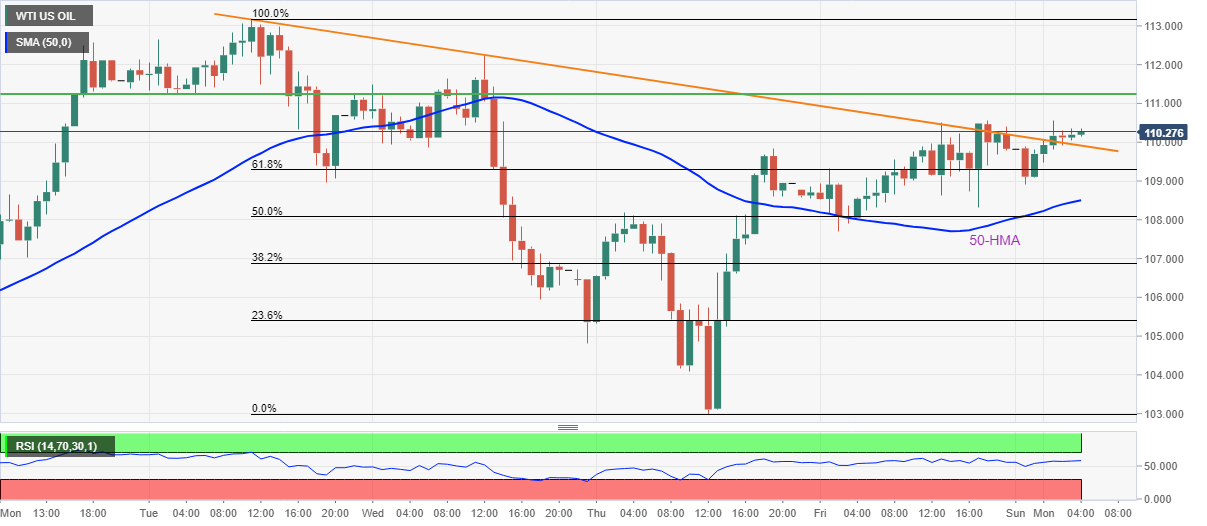
In doing so, the black gold extends the previous day’s upside break of the 50-HMA to rise past the one-week-old descending trend line.
The firmer RSI (14) line, not overbought, also backs the latest breakouts and keeps WTI buyers hopeful.
However, a horizontal area comprising multiple levels marked since May 17, around $111.30, appears a tough nut to crack for short-term oil buyers.
Following that, a run-up towards the monthly high of $115.53 can’t be ruled out.
On the contrary, pullback moves may initially aim for the previous resistance line and the 50-HMA, respectively around $109.90 and $108.50, before convincing WTI sellers.
Even so, the latest swing low surrounding $103.00 and the $100.00 psychological magnet will challenge the energy benchmark sellers.
WTI: Hourly chart
Trend: Further recovery expected