USD/CAD Price Analysis: Fades bounce off 61.8% Fibo. around 1.2800
- USD/CAD pares the first daily gains in four inside a bullish chart formation.
- Steady RSI favors recent pullback but the key Fibonacci retracement level, triangle’s support could test bears.
- 200-SMA, 1.2775 act as additional trading filters as bulls retreat.
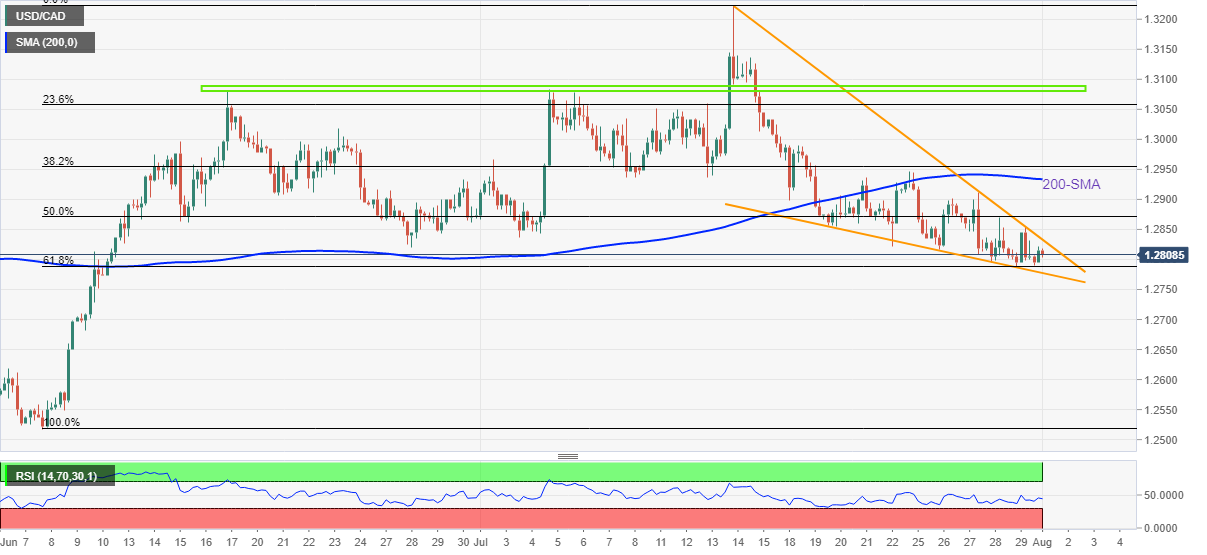
USD/CAD drops back to 1.2805 as it consolidates the first daily gains in four around the lowest levels in seven weeks, marked the previous day. In doing so, the Loonie pair stays inside a two-week-old descending triangle bullish chart pattern while recently fading the bounce off the 61.8% Fibonacci retracement (Fibo.) of June-July upside during Monday’s Asian session.
It’s worth noting that the steady RSI and the quote’s inability to keep the bounce off the key Fibo. level directs the intraday sellers towards retesting the 61.8% Fibonacci retracement support level surrounding 1.2785.
However, the pair’s downside past 1.2785 will be challenged by the stated triangle’s lower line, near 1.2775 by the press time.
In a case where the USD/CAD prices drop below 1.2775, the odds of witnessing a south-run towards breaking the 1.2700 threshold can’t be ruled out.
Alternatively, recovery moves need to cross the aforementioned triangle’s resistance line, at 1.2835 now.
Following that, the USD/CAD run-up could aim for the 200-SMA level surrounding 1.2935. However, the 1.3000 psychological magnet and a six-week-old horizontal resistance area near 1.3080-90 could challenge the pair’s upside past 1.2835.
USD/CAD: Four-hour chart
Trend: Limited downside expected