GBP/JPY Price Analysis: Retraces after testing the 200-EMA in the 4-hour chart
- GBP/JPY registers decent gains of almost 0.20% as the Asian session begins.
- The GBP/JPY daily chart depicts the pair as neutral-biased, unable to challenge the 160.00-162.80 area.
- Short term, the pair tested the 200-EMA at the H4 chart, in which sellers leaned on, sending the GBP/JPY sliding towards the 162.20s area.
GBP/JPY is advancing as the Asian session begins, though it remains trading sideways for the twelve-consecutive trading day, inside the 160.00-162.80 range, at the time of writing. The GBP/JPY exchanges hand at 162.18, above its opening price..
GBP/JPY Price Analysis: Technical outlook
The GBP/JPY remains neutral biased. For the last twelve days, the GBP/JPY has been trading within the 160.00-162.80 area, unable to break above/below the range extremes. It’s worth pointing out that the Relative Strength Index (RSI) is below the 50-midline, almost flat, while the 20-day EMA, at 161.84, is the first support level at the time of writing. On the upside, the GBP/JPY first resistance is the confluence of the 50, 100-EMAs, and a downslope trendline around the 162.80-163.00 area, which the pair had been unable to reach since August 17. On the downside, the GBP/JPY’s first support would be the September 5 daily low at 160.66.
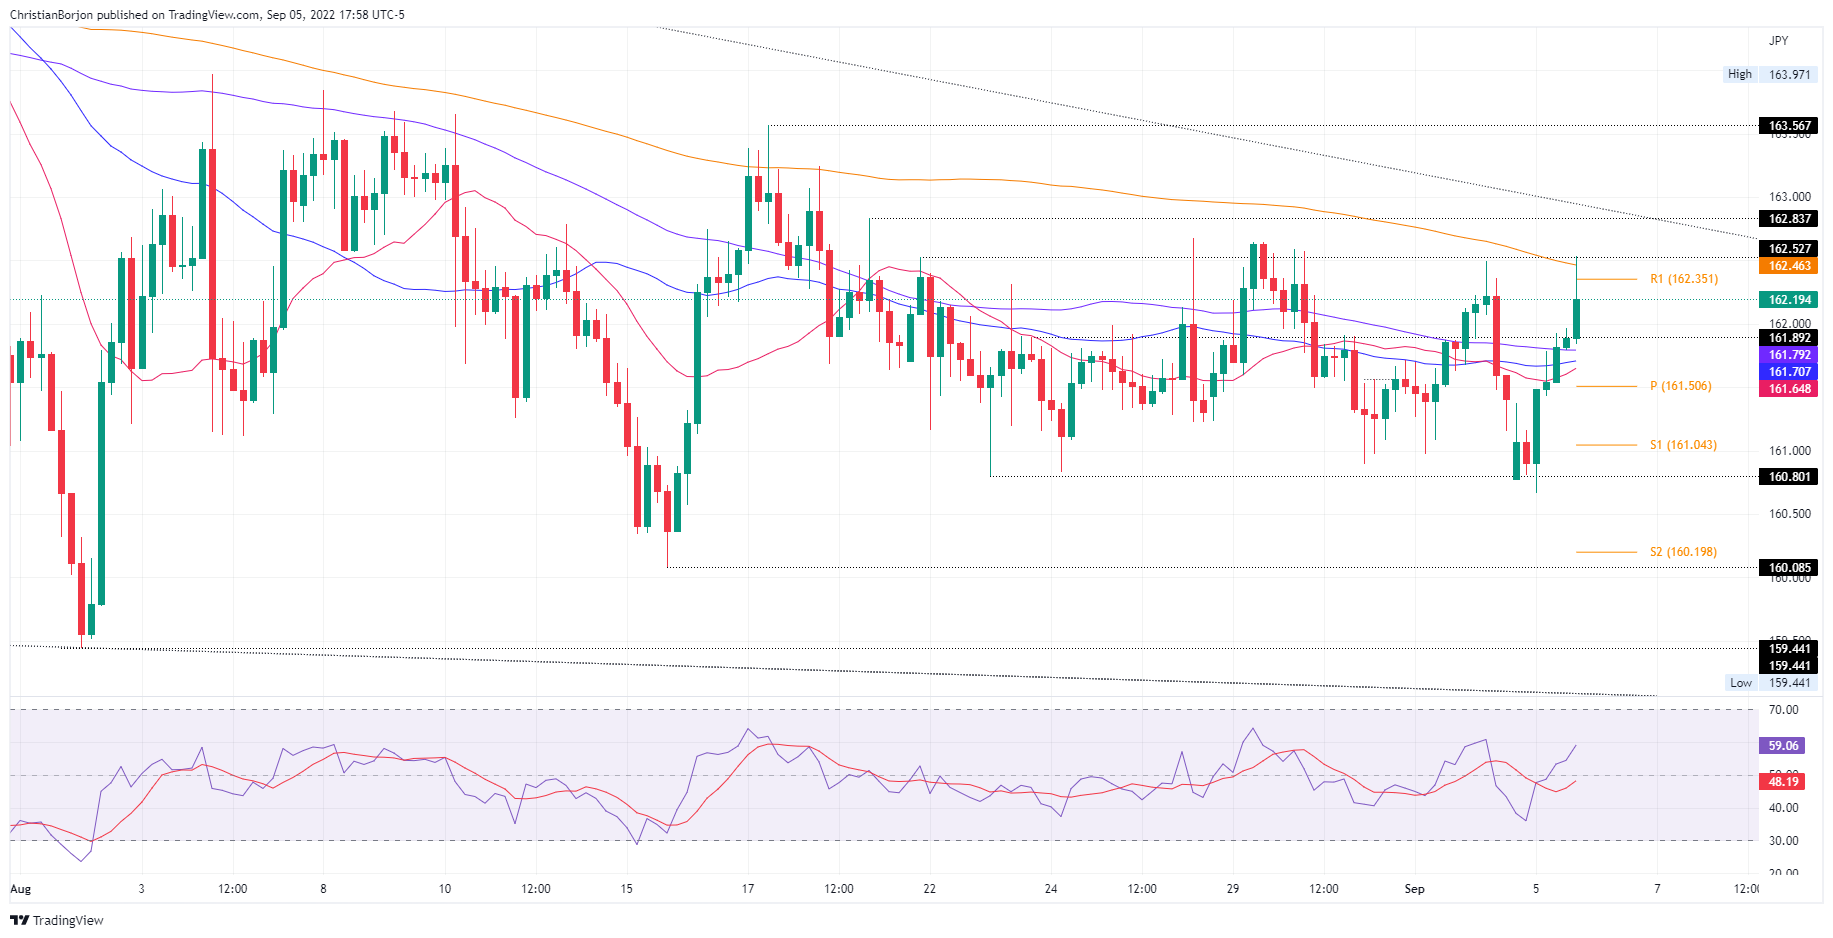
Near term, the GBP/JPY four-hour chart illustrates the cross-currency hitting September’s 2 daily high at 162.52 before retracing some pips below the R1 daily pivot at 162.35. GBP/JPY traders should be aware of the 200-day EMA at around 162.46, a difficult resistance level to overcome for GBP/JPY buyers. Once they clear the latter, that would pave the way towards 163.00, opening the door for further gains.
On the other hand, the GBP/JPY first support would be the confluence of the 20, 50, and 100-EMAs at around 161.65-161,80. Once cleared, the GBP/JPY following support would be the daily pivot at 161.50, followed by the S1 daily pivot at 161.04.
GBP/JPY Key Technical Levels