Confirming you are not from the U.S. or the Philippines

یہ بیان دے کر، میں واضح طور پر یہ بتاتا اور تصدیق کرتا ہوں کہ:
  • میں امریکی شہری یا رہائشی نہیں ہوں
  • میں فلپائن کا رہائشی نہیں ہوں
  • میں بالواسطہ یا بلاواسطہ امریکی باشندوں کے 10 فیصد سے زیادہ شیئرز/ ووٹنگ کا حق/ امریکی باشندوں کے انٹرسٹ کا مالک نہیں ہوں اور/یا دوسرے ذرائع سے امریکی شہریوں یا رہائشیوں کو کنٹرول نہیں کرتا ہوں۔
  • میں بالواسطہ یا بلاواسطہ امریکی باشندوں کے 10 فیصد سے زیادہ شیئرز/ ووٹنگ کا حق/ انٹرسٹ کا مالک نہیں ہوں اور/ یا کسی دوسرے ذریعے سے امریکی شہری یا رہائشی کے کنٹرول میں نہیں ہوں۔
  • میں FATCA کے سیکشن (a)1504 کے معاملے میں امریکی شہریوں یا رہائشیوں کے ساتھ وابستہ نہیں ہوں
  • میں غلط اعلان کرنے پر اپنی ذمہ داری سے واقف ہوں۔
اس بیان کے مقاصد کے لئے، ریاستہائے متحدہ امریکہ کے تمام منحصر ممالک اور علاقوں کو امریکہ کے مرکزی علاقے کے برابر کردیا گیا ہے۔ میں اپنے اس بیان کی خلاف ورزی سے پیدا ہونے یا اس سے متعلق ہونے والے کسی بھی دعوے کے خلاف، بے ضرر آکٹا مارکیٹس انکارپوریٹڈ، اس کے ڈائریکٹرز اور افسران کا دفاع کرنے کا عہد کرتا ہوں۔
ہم آپ کی رازداری اور آپ کی ذاتی معلومات کے تحفظ کے لیے وقف ہیں۔ ہم محض اپنی پراڈکٹس اور سروسز کے متعلق خصوصی پیشکشوں اور اہم معلومات فراہم کرنے کے لیے ای میلز اکٹھا کرتے ہیں۔ اپنا ای میل ایڈریس دے کر، آپ ہم سے ایسے ای میلز وصول کرنے پر اتفاق کرتے ہیں۔ اگر آپ انسبسکرائب کرنا چاہتے ہیں یا کوئی سوالات یا خدشات ہوں تو، ہماری کسٹمر سپورٹ کو لکھیں۔
Octa trading broker
ٹریڈنگ اکاؤنٹ کھولیں
Test
Back

AUD/USD Price Analysis: Trades inside Tuesday’s range

  • AUD/USD struggles for a direction as investors shift focus towards the US core PCE price index data.
  • Broader market mood is quite upbeat as rate cut expectations by the Fed deepen.
  • A breakout of the symmetrical triangle chart pattern has strengthened the Australian Dollar.

The AUD/USD pair trades sideways inside Tuesday’s trading range of 0.6700-0.6775 in the early New York session. The Aussie asset struggles for a direction as investors shift focus towards the United States core Personal Consumption Expenditure price index (PCE) data for November, which will be published on Friday.

The S&P500 opens on a negative note as profit-booking has kicked in. The overall market mood is quite upbeat as investors lean towards deepening rate cut expectations by the Federal reserve (Fed) in 2024. The US Dollar Index (DXY) faces selling pressure after a pullback move to near 102.50.

On the Australian Dollar front, the Reserve Bank of Australia (RBA) is expected to keep interest rates restrictive for longer as inflation in the Australian region is more than doubled the required rate of 2%.

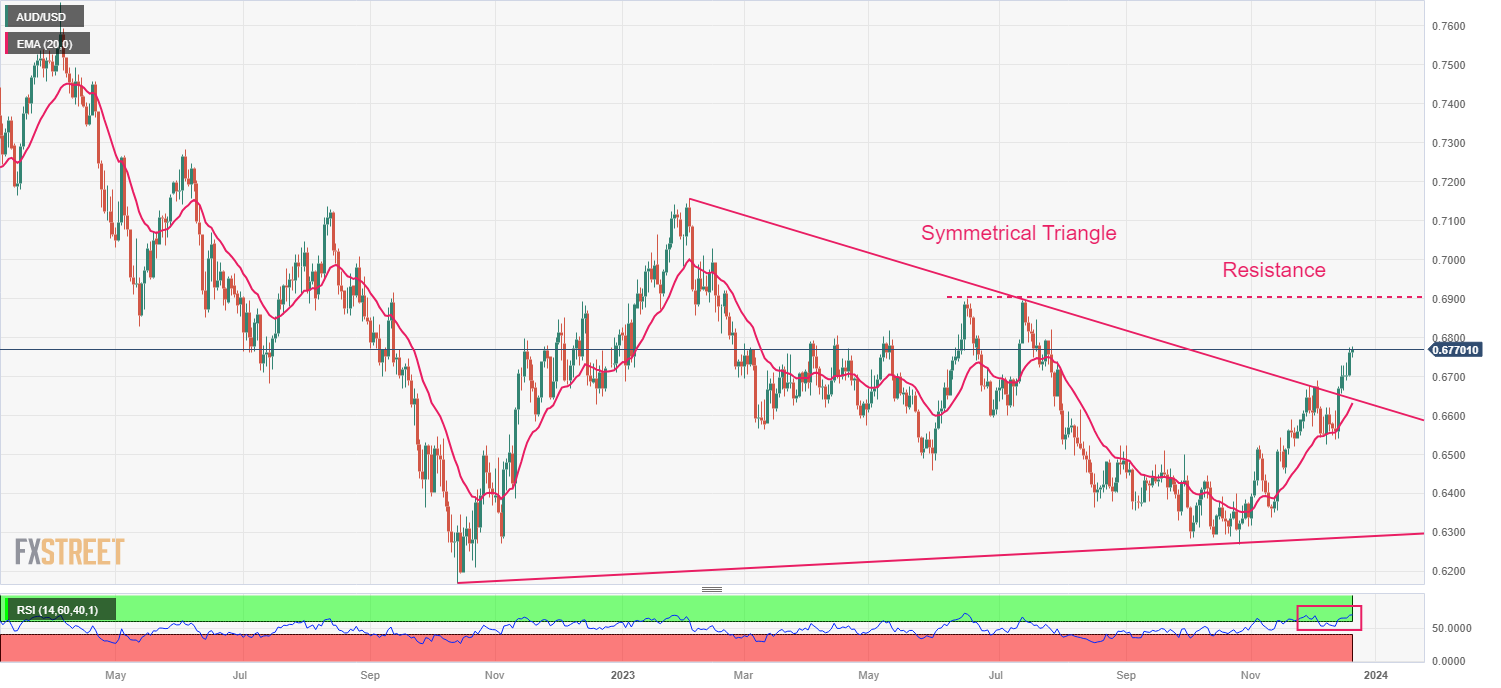
AUD/USD has continued its winning streak after a breakout of the Symmetrical Triangle chart pattern formed on a daily scale. A breakout of the aforementioned chart pattern results in wider bullish ticks and heavy volume. The asset is expected to extend upside towards the immediate resistance of 0.6900.

Upward-sloping 20-day Exponential Moving Average (EMA) around 0.6630 continues to provide support to the Australian Dollar bulls.

The Relative Strength Index (RSI) (14) shifts into the bullish range of 60.00-80.00, which indicates that the bullish momentum has been triggered.

Going forward, a decisive break above the intraday high of 0.6770 would expose the asset to July 20 high at 0.6846, followed by July 13 high around 0.6900.

On the flip side, downside bets would trigger if the asset breaks below December 7 low at 0.6525. Slippage below the same would drag the asset towards the psychological support of 0.6500 and November 17 low at 0.6452.

AUD/USD daily chart


USD Index: Further losses likely to accumulate below 102.15 – Scotiabank

The USD is trading mixed on the day as FX markets consolidate broadly.
مزید پڑھیں Previous

Gold Price Forecast: XAU/USD to average above $2,000 in 2024 – ANZ

Gold price rose more than 20% to a record high of $2,135 in 2023.
مزید پڑھیں Next